Chapter structure
- 5.1 Introduction
- 5.2 Feedstock Availability
- 5.3 The Role of Petroleum
- 5.4 The Cost of Biomass Feedstocks
- 5.5 Maximum Yield as a Function of Biomass Composition
- 5.6 Location
- 5.7 Metrics for Biochemical vs. Thermochemical Conversion
- 5.8 Biomass Chemistry
- 5.9 Hydrolysis of Polysaccharides in Cellulosic Biomass
- 5.10 Chemistry of Pretreatment
- 5.11 Chemical Degradation and Inhibitor Formation During Pretreatment
- 5.12 Impact of Formed Inhibitors
- 5.13 Conclusions
- Bibliography
- Footnotes
5.1 Introduction
The pretreatment of biomass materials for subsequent biological processing requires an understanding of the chemistry of biomass which makes up the feedstock for such processes. The combination of pretreatment and enzyme hydrolysis is a key step in deriving fermentable sugars for the subsequent transformation to ethanol or other fermentation products by either yeast or bacteria. Pretreatment can also impact the chemical processing of biomass materials to synthesis gas containing CO, methane, and other organic molecules. The chemical structure of biomass (lignocellulosic) materials determines the most appropriate combinations of pretreatment and hydrolysis. The types and sources of biomass, their structure and the overall impact of chemistry on pretreatment approaches are presented in this chapter. Recent developments in pretreatment, using water only approaches, as well as the effects of inhibitors on cellulases are also discussed.
5.2 Feedstock Availability
A recent report by the National Academies Committee on America’s Energy Future [1] addresses various topics related to sustainable energy supplies in the U.S. This study engaged a broad range of sponsors including the U.S. Department of Energy, Kavli Keck Foundations, Dow Chemical, General Electric, Intel, General Motors, and BP, as well as the National Academies. The overall conclusion of this report was that the only way to meet the concerns of a sustainable fuel supply, environmental consequences, energy security, and economic competitiveness, for the U.S. would be to embark on a sustained effort to transform the manner in which energy is produced and consumed including the conversion of lignocellulosics to fuel ethanol.
Petroleum will continue to be an indispensible transportation fuel. Transportation fuel consumption in terms of gasoline equivalents per day is expected to rise from about 2.1 billion liters (13 million barrels) in 2009 to 2.4 billion liters (15 million barrels) in 2030 [1]. Cellulosic ethanol is projected to displace about 79 million liters (0.5 million barrels) of gasoline per day by the year 2020 and 270 million liters (1.7 million barrels) per day by 2035. Some of the cellulosic ethanol benefits are that the production of a corn-based ethanol already provides some infrastructure for its distribution, and a life cycle analysis in which
 emissions are one fifth to two fifths that of gasoline. The combination of converting coal and biomass to liquid fuels has even a larger potential to displace gasoline due to the preponderance and availability of coal in the U.S., particularly if
 emissions can be limited by carbon sequestration. With carbon sequestration the amount of
 admitted would be low. The development of coal utilization with carbon sequestation technology is projected to require until 2035 in order to reach the goal of 4 billion liters (2.5 million barrels) of gasoline equivalent per day.
Renewable resources provide the benefit of a low carbon footprint and are available at a number of different sites in a sustainable manner. Conversion efficiency and the amount of biomass, which will be required on a sustainable basis, will be important factors in determining costs. Increased efficiency decreases both costs and the amount of feedstock. The types and sources of biomass include agricultural residues, wood, and purposely grown energy crops of sugarcane, energy cane, switchgrass and poplar. Up to a billion tons per year are generated and are potentially available for biofuels production. The areas of highest growth of biomass and biomass availability are in the Midwest and along the coasts as shown in Figure 5.1. Subsequent to this report, other studies estimated that the amount of the biomass available is about 400 million dried tons (Figure 5.1, American Energy Future Panel Report).
This particular estimate gives current and future (2020) quantities that may be available but does not include woody residues that might be used for the generation of electricity. The majority of the increase in the availability of lignocellulosic feedstocks is assumed to occur from dedicated fuel crops (such as switchgrass or energy cane). Reference to Figure 5.1 also shows that there is significant municipal solid waste (100 million tons per year) but here it is not considered a feedstock for biological conversion of lignocellulosic material to ethanol since a different type of processing technology would be needed. Consequently the total amount of biomass available would be about 448 million dry tons per year in 2020 (Figure 5.1, American Energy Future Panel Report). The report itself estimates that between 400 and 500 million tons of biomass can be sustainably produced in the U.S. without incurring significant direct or indirect greenhouse gas emissions. At the same time, even though the feedstock would be available, timely commercial deployment may depend on adoption of fuel mandates as well as an accelerated federal investment in essential technologies according to this report [1].
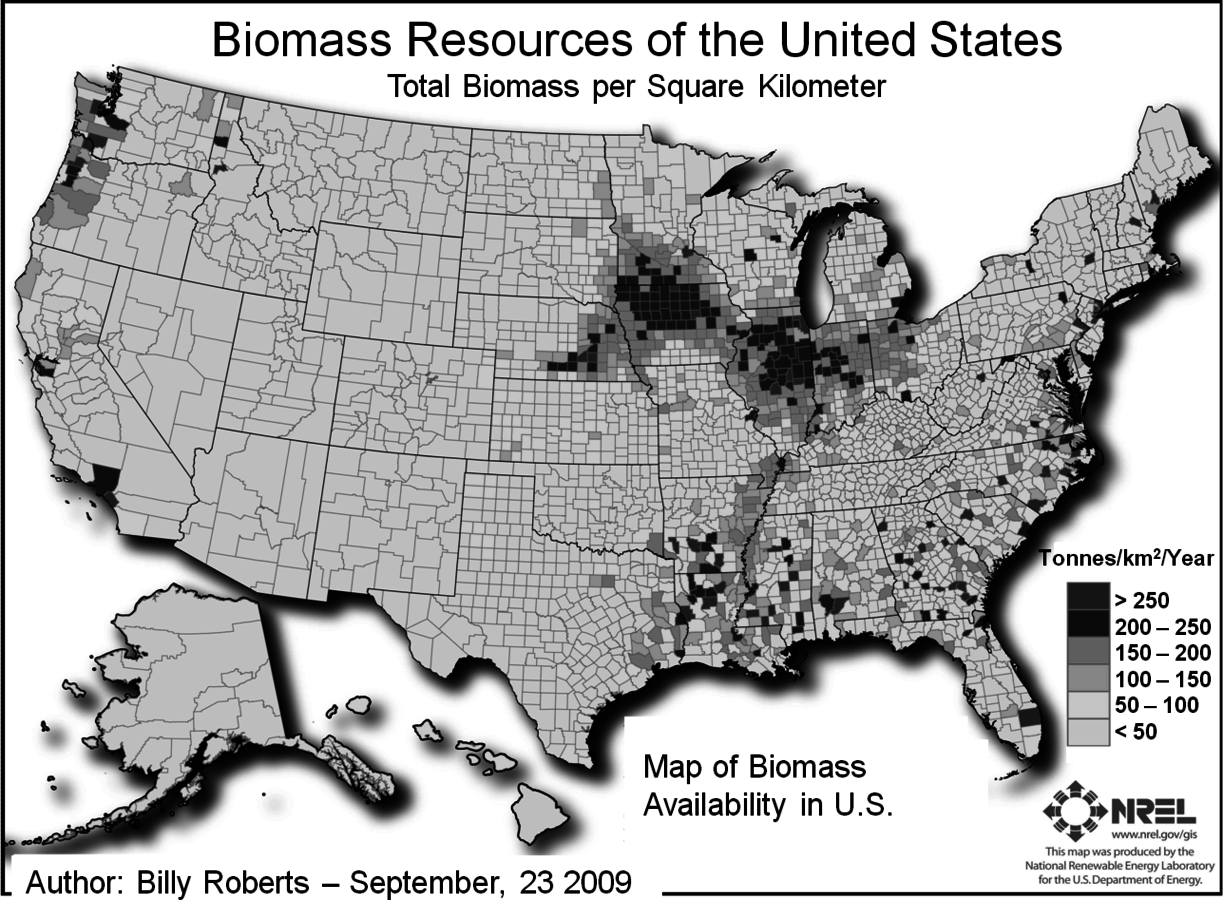
Fig. 5.1: Map of biomass availability in the U.S. This study estimates the biomass resources currently available in the United States by county. It includes the following feedstock categories: crop residues (5 year average: 2003–2007), forest and primary mill residues (2007), secondary mill and urban wood waste (2002), methane emissions from landfills (2008), domestic waste water treatment (2007), and animal manure (2002) (http://www.nrel.gov/gis/biomass.html).
5.3 The Role of Petroleum
Petroleum will continue to be an indispensable transportation fuel through at least 2035. Transportation fuel consumption in terms of gasoline equivalents per day is expected to rise from about 2.1 billion liters (13 million barrels) in 2009 to 2.4 billion liters (15 million barrels) in 2030. Cellulosic ethanol is expected to displace about 79 million liters (0.5 million barrels) of gasoline per day by the year 2020 and 270 million liters (1.7 million barrels) per day by 2035. These estimates, which are not additives, show that any of these alternative energy sources would provide small but significant additions to the total amount of liquid fuel consumed in the U.S. Some of the benefits of ethanol as a biofuel (presumed here to be cellulosic ethanol) are the production of a liquid fuel that already has infrastructure and a life cycle analysis in which CO2 emissions are one fifth to two fifths that of gasoline.
| Feedstock Type | 2008 Millions of dry tons |
2020 Millions of dry tons |
|---|---|---|
| Corn stover | 76 | 112 |
| Wheat and grass straw | 15 | 18 |
| Hay | 15 | 18 |
| Dedicated fuel crops | 104 | 164 |
| Woody residues* | 110 | 124 |
| Animal manure | 6 | 12 |
| Municipal solid waste | 90 | 100 |
| TOTAL | 416 | 548 |
Tab. 5.1: Estimated U.S. Lignocellulosic Feedstock that could potentially be produced for fuel (*Wood residues currently used for electricity generation are not included in this estimate.)
Tab. 5.1: Estimated U.S. Lignocellulosic Feedstock that could potentially be produced for fuel (*Wood residues currently used for electricity generation are not included in this estimate.)
Renewable resources will provide the benefit of a low carbon footprint, and being available at a number of different sites in a sustainable manner. Conversion efficiency will be important in determining costs.
5.4 The Cost of Biomass Feedstocks
Wood
Wood is a major potential biomass feedstock, with a cost of approximately $33.00 per green ton (or about $66.00 per dried ton). Since biomass is local, availability and price will be determined locally as well. Composition of the biomass and the fraction which may be fermented (carbohydrates) varies by biomass. Consequently, the maximum possible ethanol yield itself is a function of composition, and therefore, the yield itself will be locally determined [2-4]. A range of hard wood costs by location is given in Table 5.2 and shows that they range from $33.00 to $51.50 per green ton, or approximately double this cost if calculated on a dry ton basis (assuming 50% moisture content).
| Region | Hardwood Pulpwood $/Green Ton |
|---|---|
| Brazil | 40.00 |
| Finland | 51.50 |
| Michigan | 33.00 |
| Ontario, Canada | 38.00 |
| Russia | 37.50 |
| Sweden | 50.50 |
| U.S. Northeast | 36.00 |
Tab. 5.2: Cost of Wood (from [5])
Tab. 5.2: Cost of Wood (from [5])
A major source of ethanol is the Brazilian sugarcane industry where the sugarcane production is concentrated in the southern part of Brazil and along the coast. Sugarcane ethanol, produced from the sugar itself, accounts for approximately 26 billion liters (7 billion gallons) of fuel ethanol produced annually [6,7].
The byproduct, sugarcane bagasse, consists of the crushed stalks and cellulosic materials left over after the sugar itself has been extracted from the sugarcane. Bagasse has a composition of 24.4% hemicellulose, 39% cellulose, and 24.8% lignin. The stalks provide energy if burned in a power plant and could also yield significant ethanol with the appropriate pretreatment and conversion technology in place. The maximum ethanol yield for bagasse is approximately 456 L/ton (120 gal/ton).
Agricultural residues
Agricultural residues are globally available in the various agricultural regions of the world, including the U.S. Midwest. Hard wood is available in the upper Midwest in the U.S., as well as in Canada and Europe. Soft woods predominate in the Southeast U.S., and require different types of processing than hard woods if the goal is the fermentation of these woods into ethanol. Purposely grown energy crops may someday be generated in both the U.S. and Brazil, and possibly even in Africa. These could increase the availability of feedstock for biotransformation to fuels and chemicals.
| 2008/2009 | ||
|---|---|---|
| Planted area | 7.8 | million ha |
| Sugarcane | 622 | million tons |
| Sugar | 31.6 | million tons |
| Ethanol | 26.7 | billion liters |
| “Sugarcane brandy” | 1.5 | billion liters |
| Employees – direct | 1.0 | million |
| Employees – indirect | 2.6 | million |
| Future (2012) | ||
| Planted area | > 10 | million ha |
| Sugarcane | 1 | billion tons |
| Ethanol | 48 | billion liters |
Tab. 5.3: Sugarcane ethanol in Brazil (from [8]). Bagasse: 39% Cellulose, 24.4% Hemicelulose and 24.8% lignin. Maximum ethanol yield from sugar: 460 L/ton (121 gal/ton)
Tab. 5.3: Sugarcane ethanol in Brazil (from [8]). Bagasse: 39% Cellulose, 24.4% Hemicelulose and 24.8% lignin. Maximum ethanol yield from sugar: 460 L/ton (121 gal/ton)
The price and availability of these feedstocks are sufficient to support an emerging and sustainable renewable biofuels industry. However, significant development of the infrastructure for both feedstock collection and delivery, as well as distribution of the product will be required. The conversion of the cellulosic materials to fermentable sugars depends on the chemistry and the conditions used to unlock the potential of this chemistry for the production of biofuels through bioprocessing.
5.5 Maximum Yield as a Function of Biomass Composition
A variety of biomass feedstocks is available for conversion of cellulose to ethanol (Figure 5.2). Feedstocks which have been considered and studied include hard woods (poplar and red maple), agricultural residues including corn stover and wheat straw, as well as purposely grown crops such as switchgrass. In addition, there is sugarcane bagasse available in the southern U.S. and also in sugarcane mills that already produce ethanol in Brazil. Based on the assumption that all of the structural carbohydrates that are potentially fermentable to ethanol are hydrolyzed in a 100% efficiency, and fermentation of the formed monosaccharides is 100% efficient, maximal yields would be on the order of 405 liters per ton of dry biomass (107 gal/dry ton of biomass). However, in the fermentation step a metabolic yield of 90 to 95% should be used as the maximal number, since a small fraction of the sugar is used for growing cell biomass, maintaining cellular metabolism, and providing the energy for other housekeeping functions in the cell. In addition, it is unlikely that a 100% yield would be obtained from hydrolysis, hence a yield of 95% is assumed. As a consequence, the overall maximum practical yield is likely 90% of the total, or corresponding to 364.5 L/ton 96.3 gal/ton.
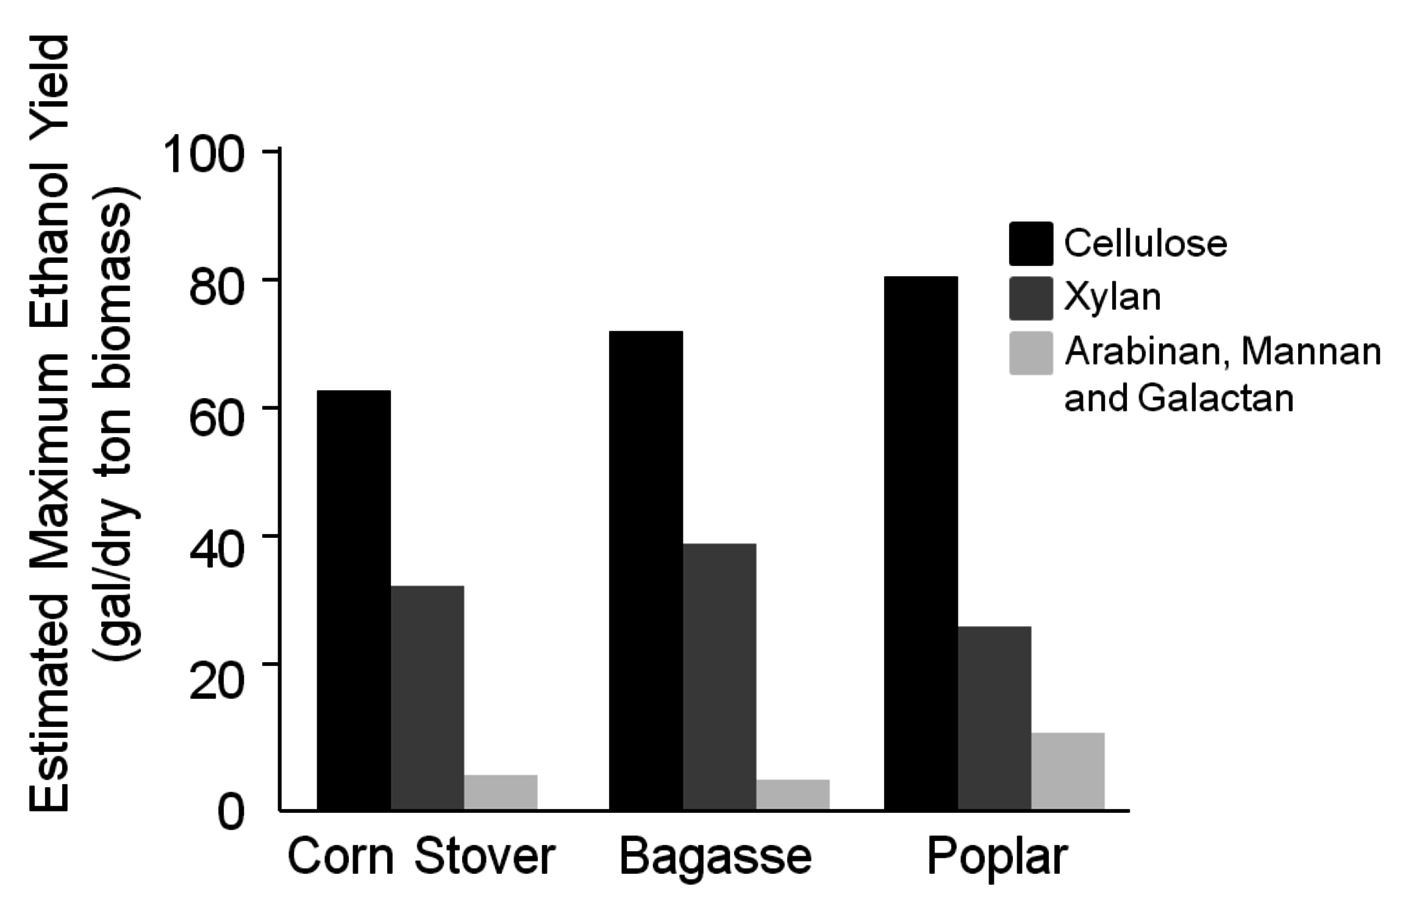
Fig. 5.2: Estimated maximum ethanol yield (gal/dry ton biomass) for individual monosaccharides present in corn stover (estimated total maximum ethanol yield of 107 gal/dry ton biomass), bagasse (estimated total maximum ethanol yield of 122 gal/dry ton biomass) and poplar (estimated total maximum ethanol yield of 124 gal/dry ton biomass), (based on information provided in Table 5.4).
Factors which could impact these yields include the efficiency with which arabinose is fermented to ethanol (a newly developed technology for yeast fermentations), as well as the conversion of xylose to ethanol [9-14]. Acetic acid, which is released from many types of lignocellulosic biomass during pretreatment and hydrolysis, may also affect yield due to its inhibitory effects [15].
| Feedstock Compositions | Poplar | Red Maple | Corn Stover | Switch grass | Bagasse *** |
Pine Wood **** |
|---|---|---|---|---|---|---|
| Cellulose | 43.8 | 41.0 | 34.6 | 33.2 | 39 | 40 |
| Xylan | 14.9 | 15.0 | 18.3 | 21.0 | 21.8 | 8.9 |
| Arabinan, Mannan, Galactan | 5.6 | 0.0 | 2.5 | 3.2 | 2.6 | 19.6 |
| Acetyl | 3.6 | 4.7 | 3.5 | 2.5 | 3.3 | N/A |
| Extractives | 3.6 | 3.0 | 10.8 | 10.2 | 5.7 | 3.5 |
| Protein | N/A | N/A | N/A | 5.7 | 0.5 | N/A |
| Lignin | 29.1 | 29.1 | 17.7 | 17.9 | 24.8 | 27.7 |
| Ash | 1.1 | 1.0 | 10.2 | 3.7 | 3.9 | N/A |
| Total | 101.7 | 93.8 | 97.6 | 97.4 | 101.6 | 99.7 |
| Estimated Maximum Ethanol Yield*, gal/dry ton biomass | 124 | 108 | 107 | 111 | 122 | 132 |
| Estimated Practical Maximum Ethanol Yield**, gal/dry ton biomass | 118 | 103 | 102 | 105 | 116 | 125 |
Tab. 5.4: Compositions of different types of cellulosic biomass and the maximum ethanol yields possible for each of the compositions. These biomass materials (wood, corn stover (stalks), and switchgrass) are representative of available feedstocks for a cellulosic biorefinery. (* Theoretical maximum yields assuming 100% hydrolysis and 100% fermentation. Data from Laboratory of Renewable Resources Engineering, Purdue University. ** 95% hydrolysis/95% fermentation. *** [16,17]. **** [18].)
Tab. 5.4: Compositions of different types of cellulosic biomass and the maximum ethanol yields possible for each of the compositions. These biomass materials (wood, corn stover (stalks), and switchgrass) are representative of available feedstocks for a cellulosic biorefinery. (* Theoretical maximum yields assuming 100% hydrolysis and 100% fermentation. Data from Laboratory of Renewable Resources Engineering, Purdue University. ** 95% hydrolysis/95% fermentation. *** [16,17]. **** [18].)
The lignin content of hard wood, poplar, and red maple is greater than that of corn stover, switchgrass, and sugarcane bagasse. This lignin has an energetic value of approximately 21,190 kJ/kg (9111 Btu/lb) [19], and could provide a significant fraction of the power required to run the ethanol plant in addition to providing electricity. Close to theoretical conversion is achievable for all of these feedstocks if enough cellulase enzymes are used with the appropriate pretreatment. However, the challenge is to carry out a pretreatment with minimal addition of chemicals, because chemicals add costs to the production of ethanol. The pretreatment must also minimize the amount of enzymes required in the hydrolysis step. Enzymes are a major cost in the production of ethanol from cellulosic materials. The fermentative microorganisms (whether yeast or bacteria) must be capable of fermenting xylose and arabinose as well as the glucose from cellulose in order to achieve maximal yields. A comparison of ethanol yields from three different feedstocks is shown in Figure 5.2 and illustrates the importance of achieving conversion of cellulose, xylan, and arabinan to ethanol.
5.6 Location
The number of sites that have the potential to supply daily amounts of biomass on a sustainable basis will be a function of the throughput, i.e., the production level of a cellulosic ethanol facility. This is also the case for facilities that would process woody biomass through thermal means to either pyrolysis oil or synthesis gas followed by Fischer Tropsch synthesis [20].
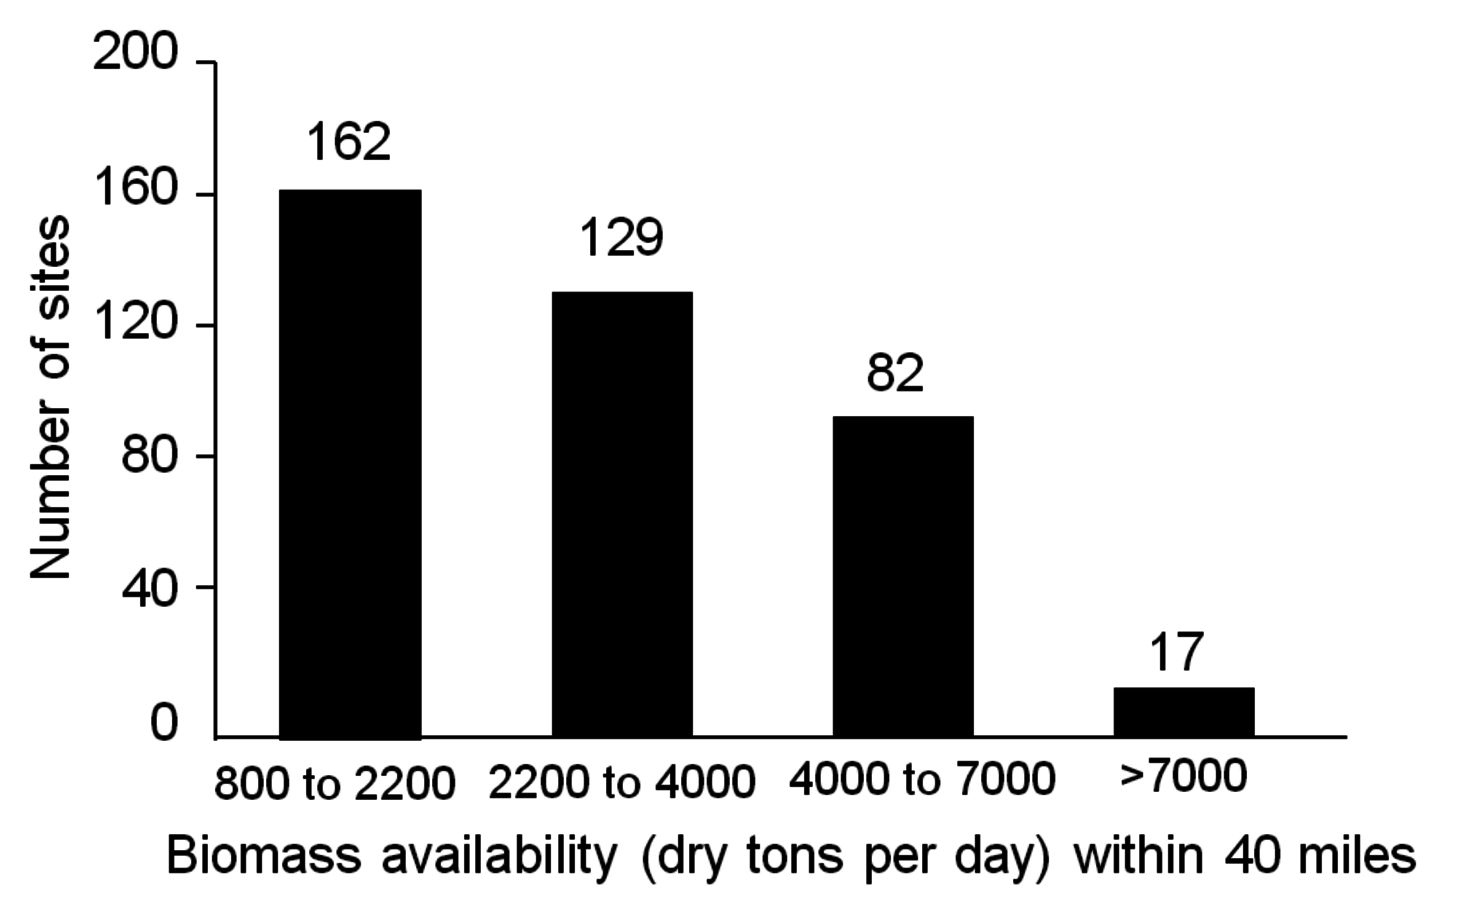
Fig. 5.3: Number of sites in the United States with potential to supply indicated daily amounts of biomass within a 40-mile radius (reprinted with permission, National Academies Report, 2009)
Biomass availability in the U.S. based on a combination of wood, agricultural residues and purposely grown energy crops could support approximately 162 processing facilities with throughputs ranging between 820 to 2200 tons per day (approximately 25 to 75 million gal/year production). In addition, there are about 17 sites where facilities are capable of processing more than 7,000 dry tons per day according to the National Academies study on America’s Energy Future (Figure 5.3). While these numbers may seem large, the reader should recognize that large pulp mills in Northern Michigan of the U.S. and in Southern Canada, have ranged in size from 3,000 to 7,000 dry tons per day. In the late nineteenth century through the end of the twentieth century, large wood pulp mills were operated in the hardwood forests of the U.S., namely in New York, Massachusetts, Ohio, and Wisconsin.1 In Brazil, pulping plants use between 7,000 and 8,000 dry tons/day of eucalyptus for paper making processes. Due to reemergence of large pulping capabilities in developing nations, the pulpwood industry is in decline in the U.S. This provides an opportunity for the production of cellulosic ethanol and biofuels from hard wood feedstocks.
5.7 Metrics for Biochemical vs. Thermochemical Conversion
The productive capacity for generating feedstocks in the U.S. ranges from 2.5–5 tons/hectare/year (1–2 dry tons/acre/year) for corn stover. Purposely grown and fertilized switchgrass could yield 12–17 tons/hectare/year (5–7 dry tons/acre/year) while poplar grown for energy purposes would have a yield of 12–25 tons/hectare/year (5–10 dry tons/acre/year) for poplar grown for energy purposes. The production of fuels may occur from either biochemical or chemical conversion (Figure 5.4), using different types of primary catalysis. Both involve pretreatment and preparation of the biomass material for subsequent conversion steps.
In the biochemical conversion process, the carbohydrates in the feedstock are hydrolyzed into constituent monosaccharides which are converted to ethanol or other valuable chemicals by microorganisms. In the case of thermo-chemical conversion, the feedstock is destroyed or broken down into small building blocks, i.e., CO and hydrogen, are reconstituted or reformed into higher molecular weight hydrocarbons and alcohols, i.e., biofuels. In the thermo-conversion process the lignin is converted into synthesis gas (syngas) along with cellulose and hemicelluloses biomass components. In spite of these differences, both processes (thermo- and biochemical conversion) will potentially convert 1 dry ton of biomass (~20 GJ/ton) to around 6.5 GJ/ton of energy in the form of biofuels, thereby giving an overall biomass to biofuel conversion efficiency of 35% [2] through thermochemical volumetric. Thermo-chemical conversion captures approximately 35% of the carbon in the final biofuel molecule, while the remaining carbon is used to provide energy for carrying out the conversion step [4]. Bioprocessing captures 50% of the carbon in the biofuel, although the fuel itself has a lower volumetric energy value (GJ/unit volume) than a hydrocarbon that might be derived from thermo-chemical processing. With either process, pretreatment of the biomass feedstock is required. The difference lies in the type of catalysis which is used to convert the pretreated biomass material into the final fuel products. In either case, understanding the chemistry of biomass and the manner in which the biomass may be deconstructed will help to inform selection of conditions and processing technologies for transforming lignocellulosic materials into renewable fuels.
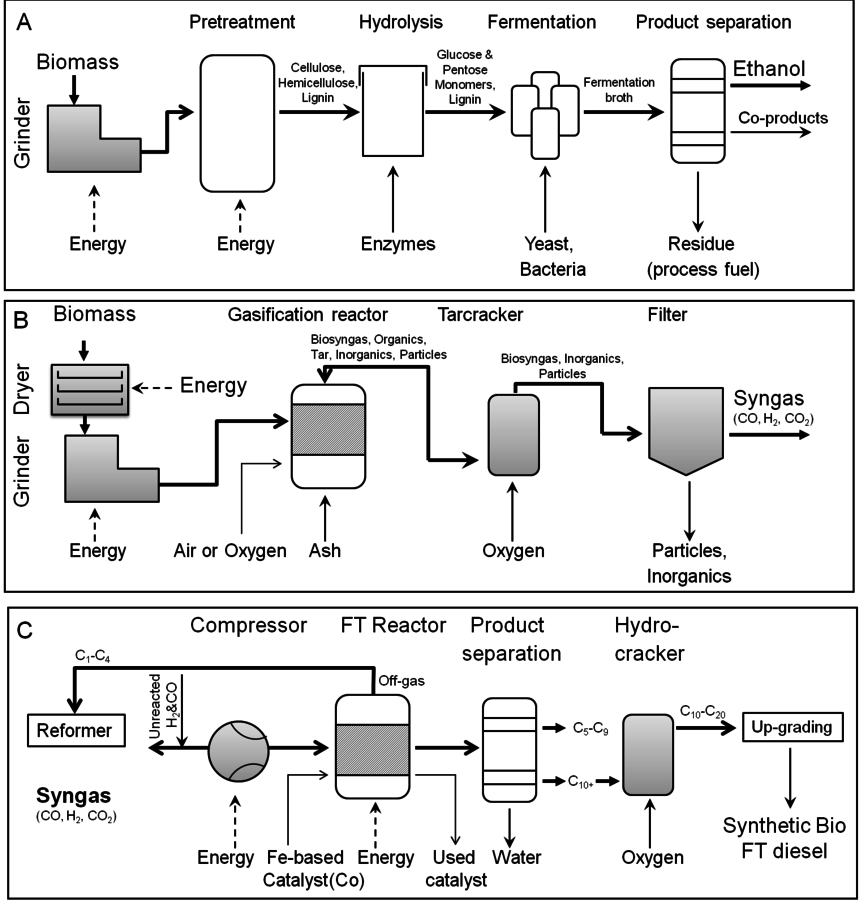
Fig. 5.4: Production of fuels can occur from either biochemical or chemical conversion. (A) Process flow diagram for ethanol production from lignocelluloses; (B) Process flow diagram for syngas production and (C) Process flow diagram for synthetic bio FT diesel production using syngas as a feedstock (Figures from [20])
5.8 Biomass Chemistry
5.8.1 Composition
The major constituents of a plant cell wall are cellulose, hemicellulose, and lignin.2 The structural carbohydrates, consisting mainly of cellulose and hemicellulose, are organized into the cell wall structure with lignin serving as a binding constituent, improving structural integrity, and protecting the plant against plant path- ogens and insects. Composition of the plant biomass will vary between one species and another with ratios of hemicellulose (xylan) to cellulose decreasing as the biomass source moves from agricultural residues and grasses to hardwood to softwood.
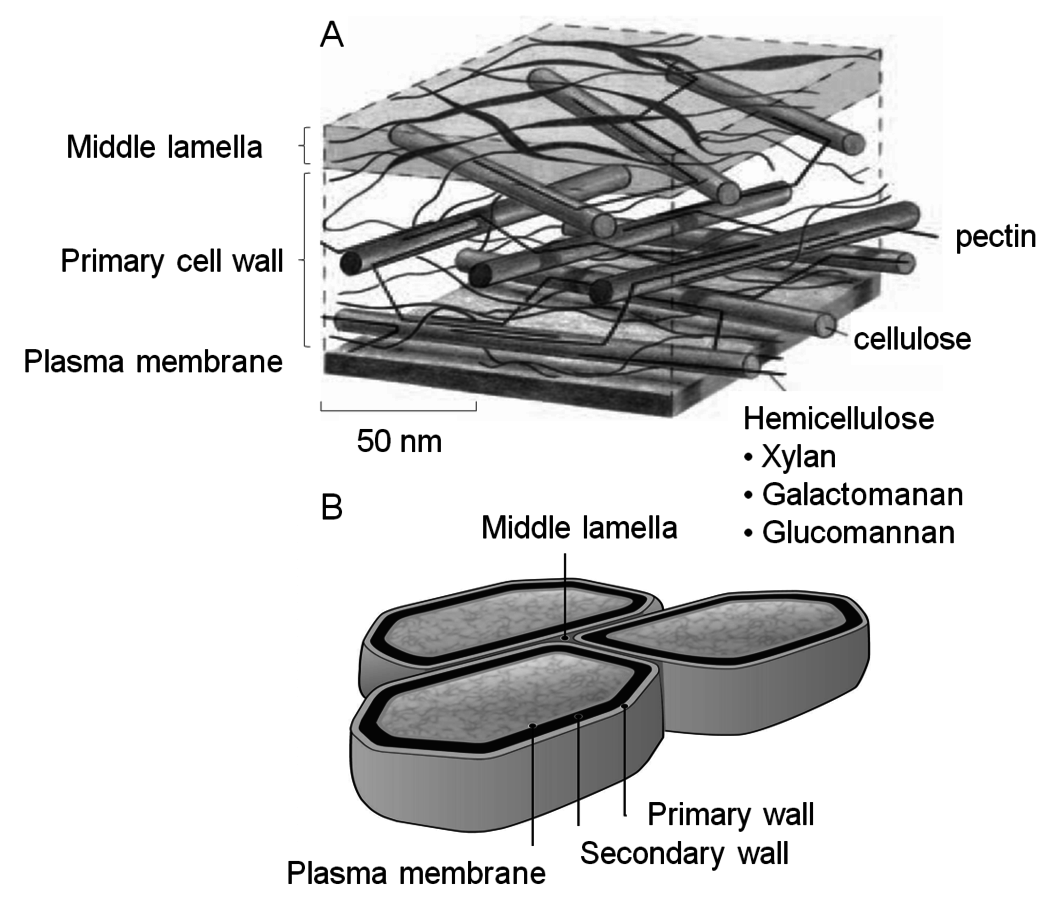
Fig. 5.5: Simplified model of the primary cell wall (A) based on McCann and Roberts (1991), and (B) from ORNL (http://public.ornl.gov/hgmis/gallery/default.cfm?restsection)
Lignin has a polyaromatic structure and makes up 18 to 29% of the lignocellulosic biomass. This component has high energy content due to its relatively low oxygen content compared to carbohydrates and is highly resistant to biochemical conversion. The second major component is hemicellulose which makes up 23 to 32% of lignocellulosic biomass (Figure 5.5A). Hemicellulose is a heterogeneous polymer that is primarily composed of 5-carbon sugars, with xylose being predominant. Previously xylose has been considered a marginal biochemical feedstock because of the prior difficulty of fermenting xylose to ethanol. However since about the year 2000, pentose-fermenting yeasts have been developed and are quite effective in converting the monosaccharides derived from this polymer into ethanol have been developed [10-14]. The third major component in lignocellulosic biomass is cellulose itself, comprising 38 to 50% of the biomass. It is a linear polymer of glucose and is the most abundant form of carbon in the biosphere.
5.8.2 Organization of the Plant Cell Wall
The plant cell wall consists of the primary and secondary wall, in which the cellulose is associated with hemicellulose (Figure 5.5B). The primary wall is separated from the secondary wall by a thin plasma membrane. The cell walls are interspersed with lignin, which is more prevalent in the cell walls of tissues that transport nutrients and water and provide structural integrity to the plant. Lignin helps the plant to resist attack by naturally occurring pathogens by inhibiting hydrolytic action of degradative enzymes. The primary wall is separated from the secondary wall by a thin plasma membrane. The cells themselves are surrounded by the middle lamella, in which the pectin-rich intercellular material cements together the primary walls of adjacent plant cells. Cellulose is protected from degradation by the combination of its crystalline structure, cross-linking by hemicelluloses (xylan), and the lignin that surrounds its multi-polymer structures (i.e., microfibrils, Figure 5.6). The deposition of polysaccharides in a plant illustrated in Figure 5.6 shows how a network of fibers is laid down giving the cell wall a self-assembled complex structure of a multi-layer polymeric network.
One of the objectives of cellulose pretreatment is to expose the cellulosic fraction of the cell wall while removing the hemicellulose fraction in order to substantially improve the accessibility of the cellulose for carrying out enzymatic hydrolysis. In addition, it is known that xylo-oligosaccharides as well as phenolics released by the lignin during pretreatment, cause severe inhibition and deactivation of cellulase enzymes that depolymerize cellulose to glucose [22-26]. The crystalline structure of cellulose (Figure 5.6) further impedes the hydrolytic action of cellulases.
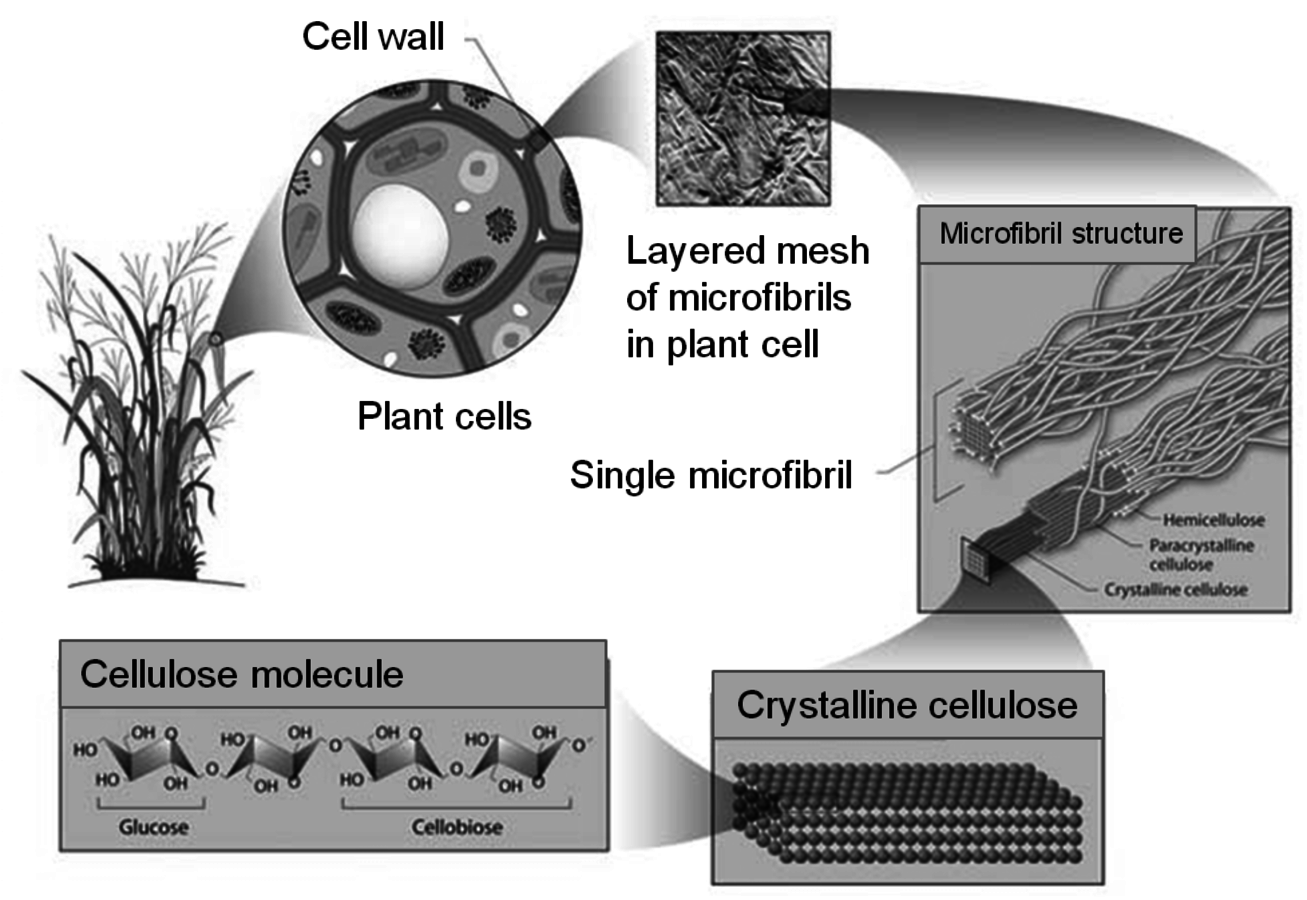
Fig. 5.6: Plant Cell Wall Stucture (http://public.ornl.gov/hgmis/gallery/default.cfm?restsection=)
5.8.3 Chemical Structures of Hemicellulose, Cellulose, and Lignin
Hemicellulose has a branched chain structure and is chemically heterogeneous while cellulose has a linear structure and is chemically homogeneous. The sources of recalcitrance in the biomass cell structure, and therefore the biomass feedstock itself, are due to the organization of cell wall structure. The role of lignin within the cell wall (as described above), and cellulose crystallinity in which linear chains of cellulose form crystalline regions that protect against hydrolysis. Hemicellulose itself is intercalated between the cellulose structures, and therefore its removal through dissolution or hydrolysis opens up pores to allow more cellulose to become accessible to hydrolytic enzymes or other hydrolytic catalytic agents.
The basic structure of most hemicellulose in biomass materials consists of linked D-xylosyl residues β–1–4 to which various other constituents are attached as short side chains. These include α–4–0-methylglucuronic acid, acetyl, alpha-arabinofuranose, and possibly several other types of uronic acid groups. A sche- matic representation of the structure, as well as the enzymes that hydrolyze these various structures is given in Figure 5.7.
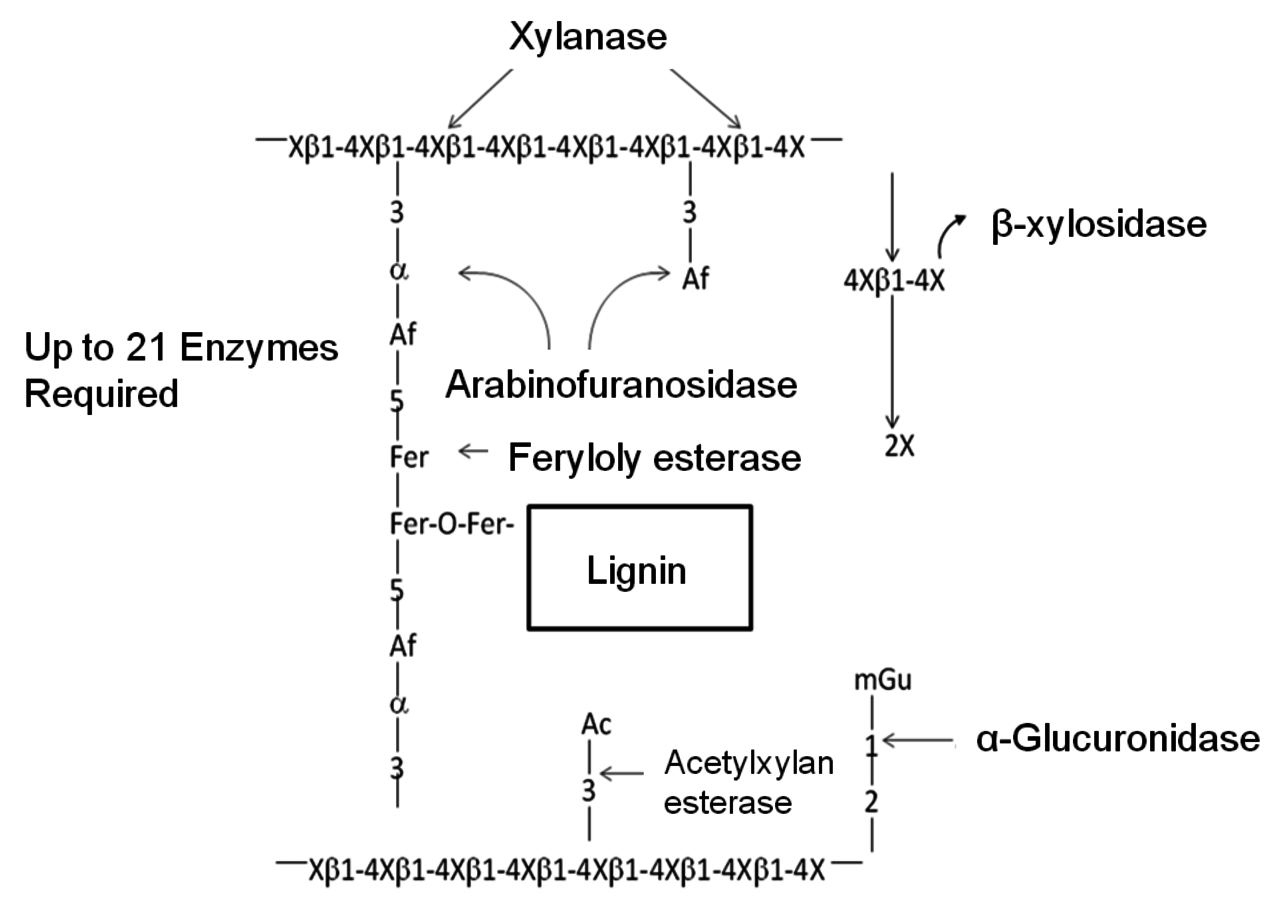
Fig. 5.7: Schematic representation of a typical hemicellulose structure and the enzymes that hydrolyze the various bonds (Adapted from [27]). X = xylose, Af = alpha-arabinofuranose, mGu = methylglucuronic acid, Ac = acetyl and Fer = ferulic acid
In most grasses, ferulic acid is known to crosslink plant cell wall polysaccharides to each other and to lignin, limiting the hydrolysis of these substrates by polysaccharide hydrolases (Figure 5.7). Feruloyl esterases (EC 3.1.1.73), also known as ferulic acid esterases, cinnamic acid esterases, or cinnamoyl esterases, are a class of enzymes that are involved in the liberation of ferulic acid and other cinnamic acids from plant cell wall polysaccharides. These enzymes have potential for industrial applications in bioethanol production, and the food, the health, the pulp, and the paper industries [28].
Unlike hemicelluloses, cellulose is a chemical homogeneous polymer consisting of glucose molecules linked through β–1–4 glycosidic bonds (Figure 5.8A). It resists chemical and biological hydrolysis because of its structure. Cellulose in plant cell walls is synthesized as microfibrils with a highly crystalline core [29].
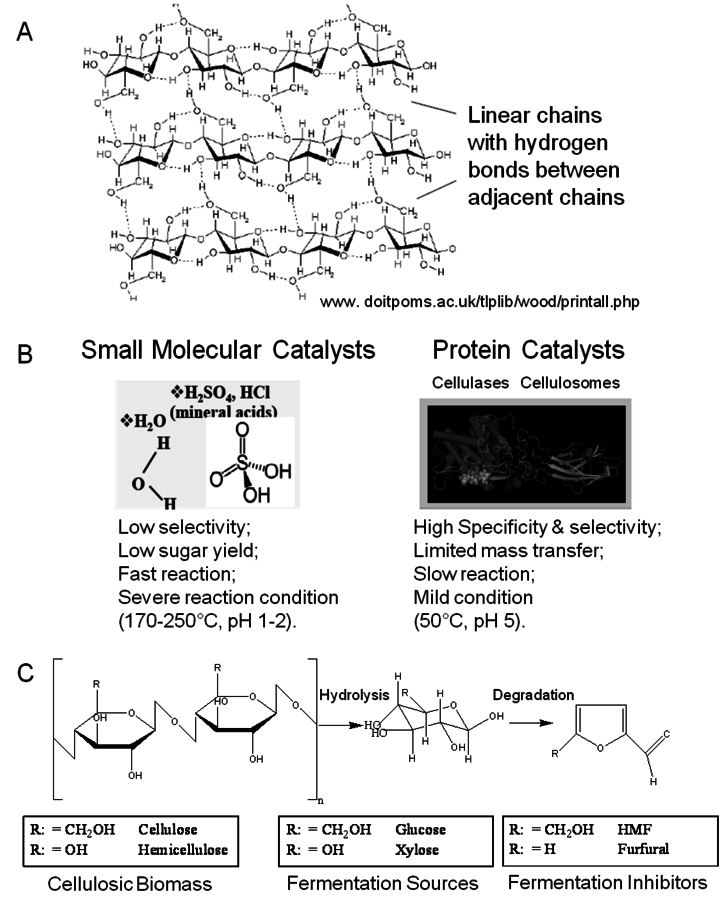
Fig. 5.8: A) Representation of the crystalline structure of cellulose and the formation of intra- and inter-chain hydrogen bonds (www.doitpoms.ac.uk/tlplib/wood/printall.php); (B) Representation of catalysts capable of hydrolyzing cellulose into its monomeric units [30]; (C) Hydrolysis by acid results in degradation products. In the case of hemicellulose the sugars formed will again degrade into aldehydes, in this case, furfural inside of hydroxymethyl furfural as would be derived from glucose [30].
The chair conformation of the glucose residues in cellulose forces the hydroxyl groups into radial (equatorial) orientation and the aliphatic hydrogen atoms into axial positions. As a result, there is strong interchain hydrogen bonding between adjacent cellulose chains which form hydrogen-bonded ribbons. Weaker, but significant, hydrophobic interactions between cellulose ribbons result in the crystal structure that resembles a stack of sticky ribbons. The combination of strong interchain hydrogen bonds and hydrophobic stacking effectively excludes water from the structure, thus making crystalline cellulose resistant to acid-cata- lyzed hydrolysis [31]. The strong interchain hydrogen-bonding network also makes crystalline cellulose resistant to enzymatic hydrolysis [29], unless this structure is disrupted. Hemicelluloses and amorphous cellulose are readily digestible [32].
Lignin is a phenolic polymer composed of three major types of building blocks: p-hydroxyphenyl (H), guaiacyl (G) and syringyl (S) units. Lignin is a major contributor to the recalcitrance of biomass and has been a target for feedstock improvement through genetic engineering. It has been demonstrated in several plant species that a reduction in lignin content using transgenic approaches enhances cell-wall degradability. Plants are amenable to wide ranges in lignin composition changes, including variation in the content of conventional monomers and the incorporation of atypical precursors [33-35]. However, significant improvement in conversion efficiency has often been accompanied by abnormal plant growth and development [36,37].
5.9 Hydrolysis of Polysaccharides in Cellulosic Biomass
Cellulose hydrolysis may be carried out by small molecule catalysts such as
 and HCl. These particular acids will act at temperatures between 170 and 250 °C and a pH of 1–2. Advantages are fast reaction; disadvantages include low potential sugar yields and low selectivity. In the case of strong acids, protons completely dissociate from the acid catalyst itself in a mechanism known as specific acid catalysts (Figure 5.8B). In this case catalytic efficiency depends only on pH, i.e., proton concentration. The formation of glucose or other monomers occurs rapidly, with the degradation of these monomers by chemical dehydration to form aldehydes and acids also occuring almost as rapidly (Figure 5.8C). These principles apply to cellulose as well as hemicellulose. Consequently, the yields from the acid hydrolysis rarely exceed 60% since a major fraction of the sugars that are formed will degrade. Molecules formed through sugar degradation inhibit fermentations and must be removed or somehow remediated so that the remaining sugars can be efficiently fermented into ethanol using microbial biocatalysts such as yeast.
In comparison, cellulases form a complex mixture in order to hydrolyze cellulose. These particular protein catalysts have the disadvantage of a slow reaction and limited mass transfer. Advantages are hydrolysis at mild conditions with high specificity and selectivity and yield (represented in Figure 5.8B). Cellulases act on carbohydrates through a general acid catalysis mechanism. Both protons and the undissociated forms of the acid catalysts at the active site of the enzyme contribute to the overall catalytic efficiency. Unlike inorganic acids, however, this reaction proceeds at much lower temperatures, with 30 to 50 °C being typical, Figure 5.9 [38].
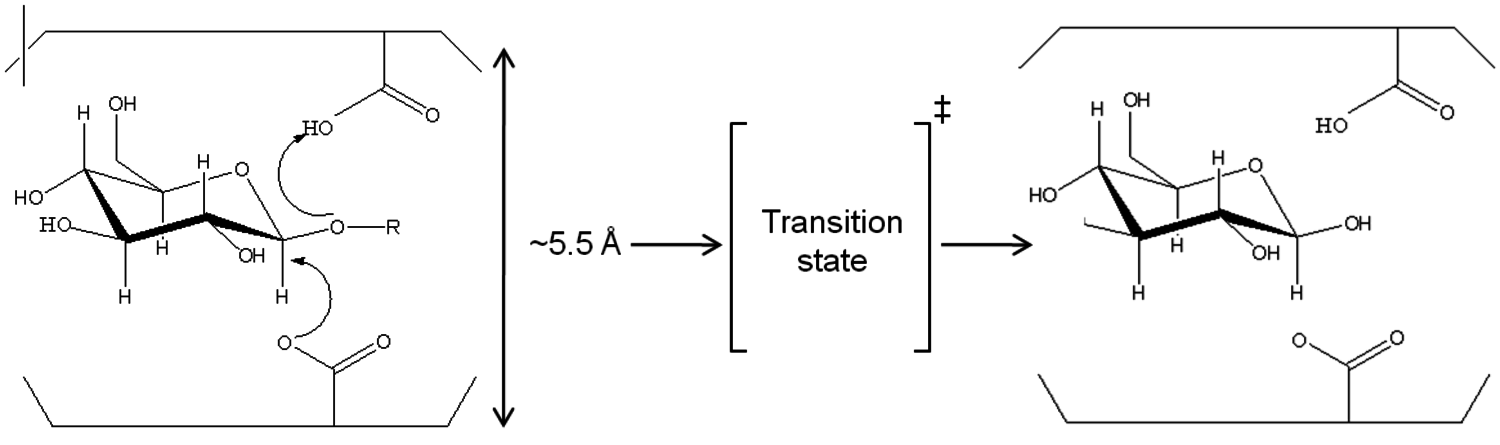
Fig. 5.9: Di-acid mechanism of enzymatic hydrolysis of polysaccharides [38]
5.10 Chemistry of Pretreatment
Because of these factors it is important to pretreat cellulose so that it becomes accessible to the catalysts (either acid or enzymes) so that the reaction may occur more rapidly. The schematic representation of pretreatment in Figure 5.10 [30] gives an illustration of how the lignin seal surrounding the cellulose microfibril (heavy black lines) prevents contact of the catalysts with the crystalline structure of the cellulose (straight black lines) within which hemicellulose is intercalated or trapped within these structures (irregularly drawn line). Upon pretreatment, the lignin seal is broken (requires pretreatment to be carried out above the melting temperature of lignin), the xylooligosaccharides are dissolved or removed, and the cellulose itself is partially disrupted.
A preferred method of pretreatment is to cook the cellulose in liquid hot water at high temperatures and pressures. After an exposure of 10–20 minutes at temperatures above 195 °C, the cell wall structure will be disrupted at a submicron scale as in Figure 5.10. For this pretreatment approach, the objective is to maintain the pH between 4 and 7, and to use a temperature between 160 to 210 °C while maintaining the water in liquid state under pressure to minimize degradation reactions [39-44]; [45] summarized by [46]. This particular approach differs from the hydrothermal pretreatment which has the goal of hydrolysis of the hemicellulose in order to fractionate the biomass into dissolved 5-carbon and insoluble 6-carbon sugar streams [47].
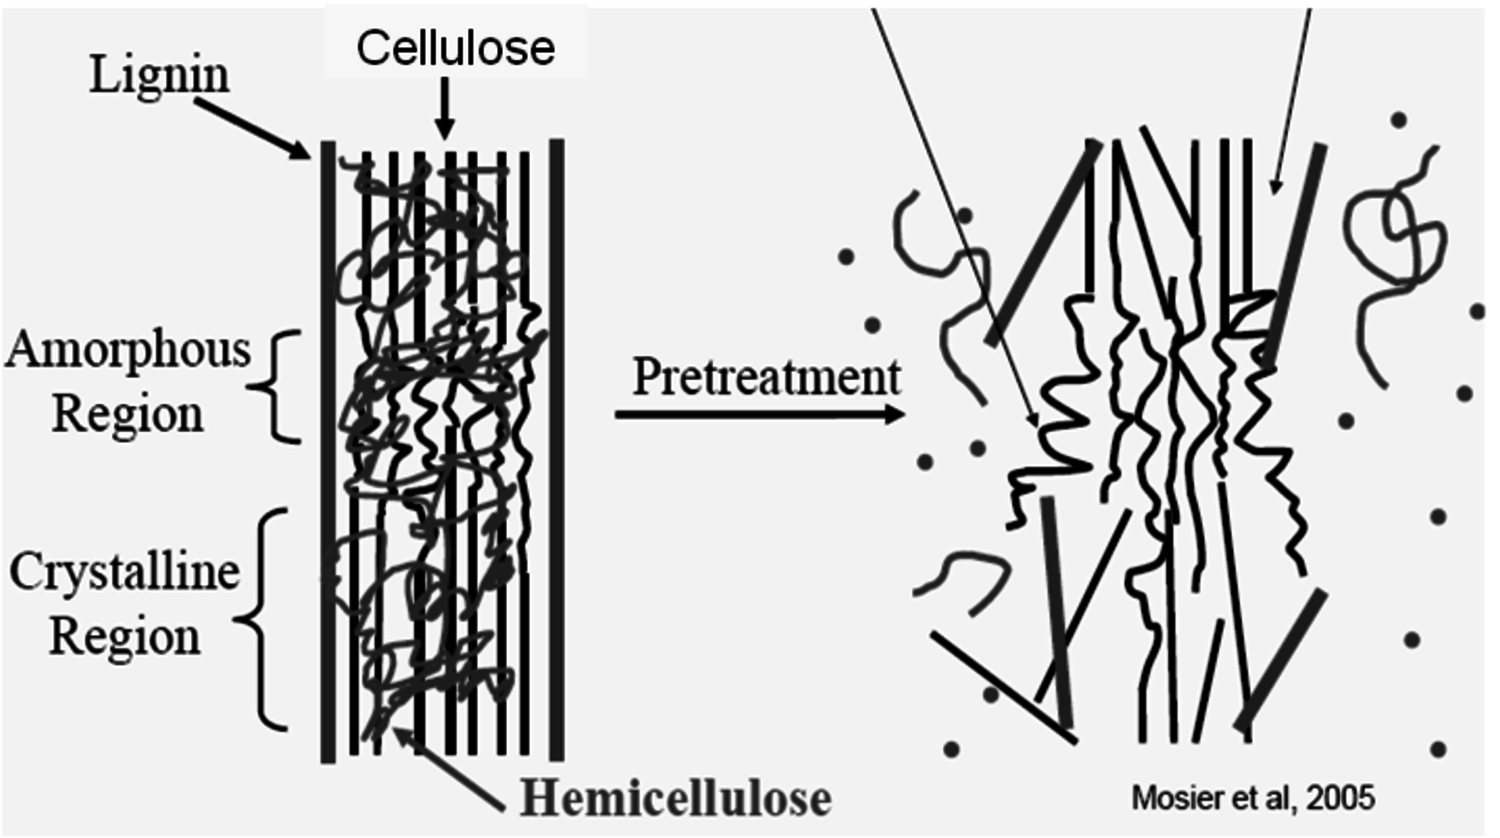
Fig. 5.10: Schematic representation of the effect of pretreatment on cellulose structure [30]
Water itself acts as the catalyst with the self-dissociation equilibrium constant (Kw) equal to 0.01x10⁻¹² at 25 °C and 6x10-12 at 230 °C. These values represent the dissociation of water into H+ and OH-, with higher temperatures resulting more dissociation and thus higher concentration of catalytic protons. Hence, at temperatures above about 230 °C, or at long cooking times (measured in terms of an hour or more), the catalytic action of water will result in acid hydrolysis of cellulose to monosaccharides, and degradation of the formed monosaccharides to organic acids, aldehydes, and humic substances.
5.11 Chemical Degradation and Inhibitor Formation During Pretreatment
Pretreatment carried out in liquid hot water, sulfuric acid,
 or other acids will rapidly degrade any monosaccharides that might be formed, particularly pentoses (5-carbon sugars). Pentoses have a lower energy of activation for the reaction of degradation than glucose (Figure 5.11, [48]). As the hemicellulose is hydrolyzed, xylose will form and then rapidly be degraded to furfural (as shown in the equation in Figure 5.12).

 , for the degradation of (○) pentoses, (∆) hexouronic acids and (□) hexoses in subcritical water [48]. The E and
 values were cited from a previous study [49]. The pentoses, hexouronic acids and hexoses are represented by the first three letters of their names, except for glucose – Ara: arabinose, Lyx: lyxose; Rib: ribose, Xyl: xylose; Glu: glucuronic acid; Fru: fructose; Gal: galactose; Glc: glucose and Man: mannose. The plot for the galacturonic acid was beyond the values shown in the figure.
Fig. 5.11: Relationships between the activation energy, E, and the natural logarithm of the frequency factor,
, for the degradation of (○) pentoses, (∆) hexouronic acids and (□) hexoses in subcritical water [48]. The E and
values were cited from a previous study [49]. The pentoses, hexouronic acids and hexoses are represented by the first three letters of their names, except for glucose – Ara: arabinose, Lyx: lyxose; Rib: ribose, Xyl: xylose; Glu: glucuronic acid; Fru: fructose; Gal: galactose; Glc: glucose and Man: mannose. The plot for the galacturonic acid was beyond the values shown in the figure.
Furfural and acetic acid are significant inhibitors of yeast that ferment these sugars to ethanol [15,50]. Acetic acid released during hydrolysis of hemicelluloses is also inhibitory.
Liquid hot water pretreatment, when carried out in a media in which the pH is maintained between pH 4 and pH 7 minimizes the formation of xylose, glucose and other monosaccharides, which are a necessary intermediate for the formation of furfural and other sugar degradation products. Consequently, the objective of pretreatment at these conditions is to control severity and pH in order to minimize formation of monosaccharides, leaving oligosaccharides in liquid solution to be processed separately and selectively to monosaccharides without degradation.
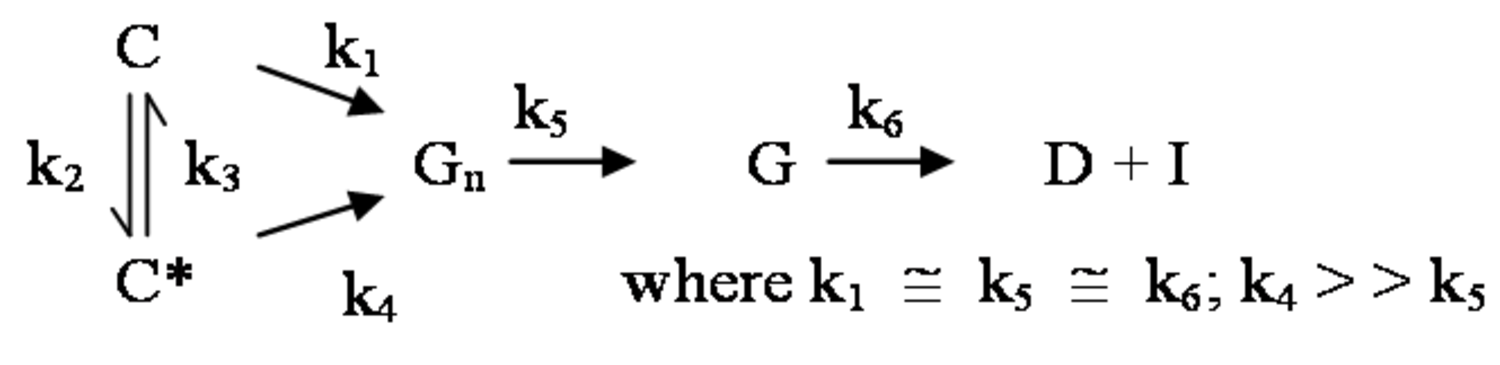
Fig. 5.12: Equation 1
Whether the hemicellulose is partially or completely hydrolyzed, pretreatment removes hemicellulose from the lignocellulose structure. Once pretreated, the cellulose is more accessible to cellulases. The benefits of using liquid hot water, other than avoiding the added cost of additional chemicals, is the ability to control and minimize formation of undesirable degradation products through control of time and temperature. The pretreatment process consists of slurrying the biomass material with water, pressure cooking it at temperatures between 160 and 220 °C [39-44]; [45] summarized by [46], cooling the material, then recovering and washing it. The washed substrate is then exposed to enzymes or fermentative microorganisms that generate their own enzymes in order to hydrolyze cellulose to glucose and ferment to ethanol. The liquid wash water contains oligosaccharides, which are also fermentable to ethanol upon hydrolysis to their constituent monosaccharides.
The pathway by which degradation products might be formed from the cellulose itself, is illustrated in equations 2 through 6. Native cellulose which is in a crystalline form and exhibits recalcitrance with respect to enzyme hydrolysis is converted to a more reactive form (represented by C* in the equation in Figure 5.13), with both forms being hydrolyzed through the action of water during pretreatment. Both forms of cellulose give oligosaccharides which in turn may be hydrolyzed to glucose. In the absence of degradation, the major product that would accumulate is glucose as illustrated in the equation in Figure 5.13, where degradation products are indicated to be a very small fraction of the overall final solutes in the pretreatment liquid as indicated by the light color. Since hydrolysis during pretreatment is a form of acid catalysis, it would be expected that most of the soluble products derived from the pretreatment would be obtained through the reaction of activated cellulose (C*) which forms oligosaccharides and then glucose (equation in Figure 5.14). However, due to the rapid reactions at high temperatures most oligosaccharides will form a mixture of glucose and degradation products if the hold time at temperature is too long (equation in Figure 5.15). An appropriate pretreatment condition will utilize conditions that separate the two sets of reactions so that the predominant change that occurs during pretreatment is the physical conversion to the reactive form (C to C*) (equation in Figure 5.16). Once the pretreatment is completed, the material is cooled to room temperature. The reactive cellulosic material is then hydrolyzed to oligosaccharides and glucose by enzymes using the mechanism illustrated in the equation in Figure 5.17. In this manner, the formation of the degradation products that are inhibitory to either enzymes or fermentative microorganisms may be minimized. Any other products that might be formed could also be removed by washing the solid material after cooling and before enzymatic hydrolysis for processing in a separate hydrolysis.
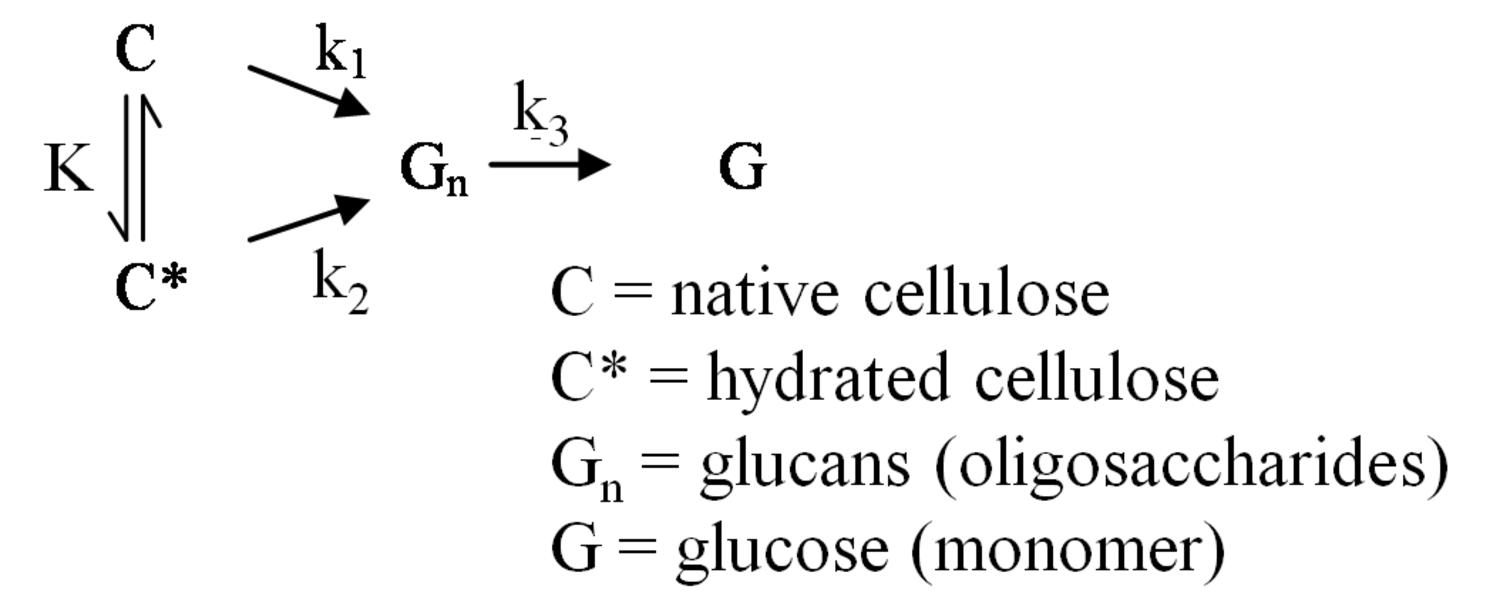
Fig. 5.13: Equation 2
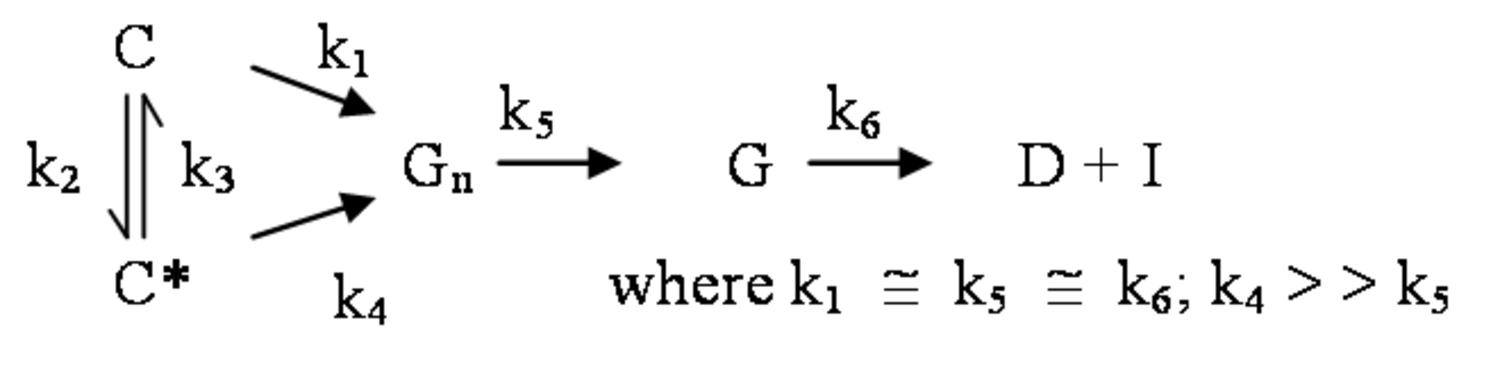
Fig. 5.14: Equation 3
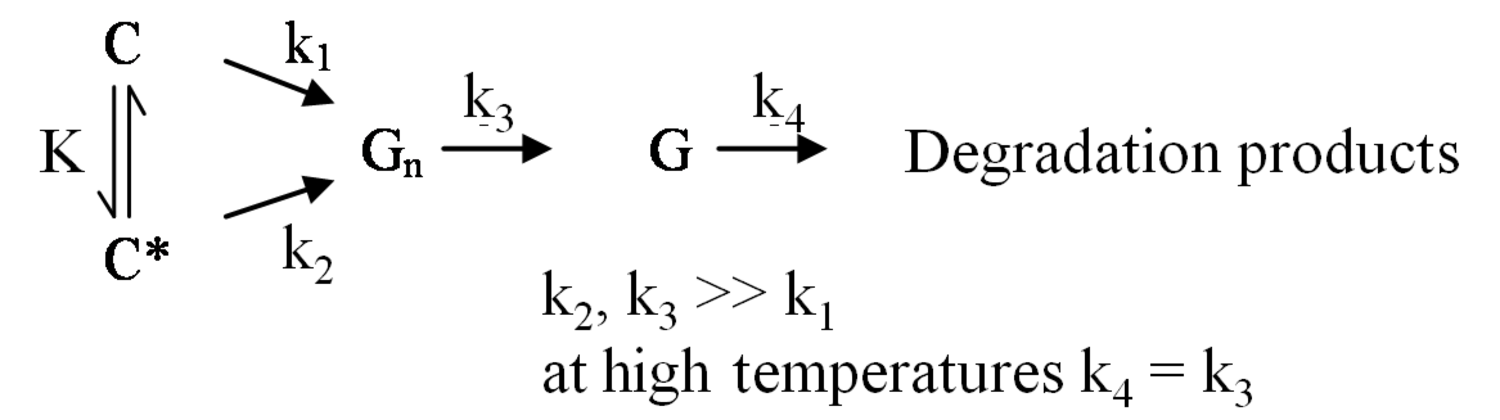
Fig. 5.15: Equation 4
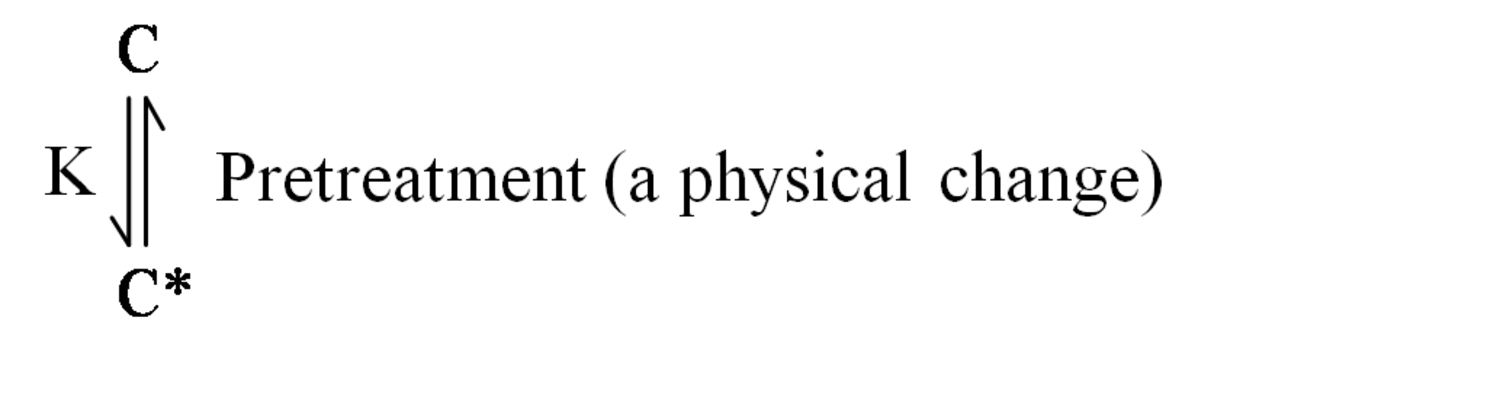
Fig. 5.16: Equation 5
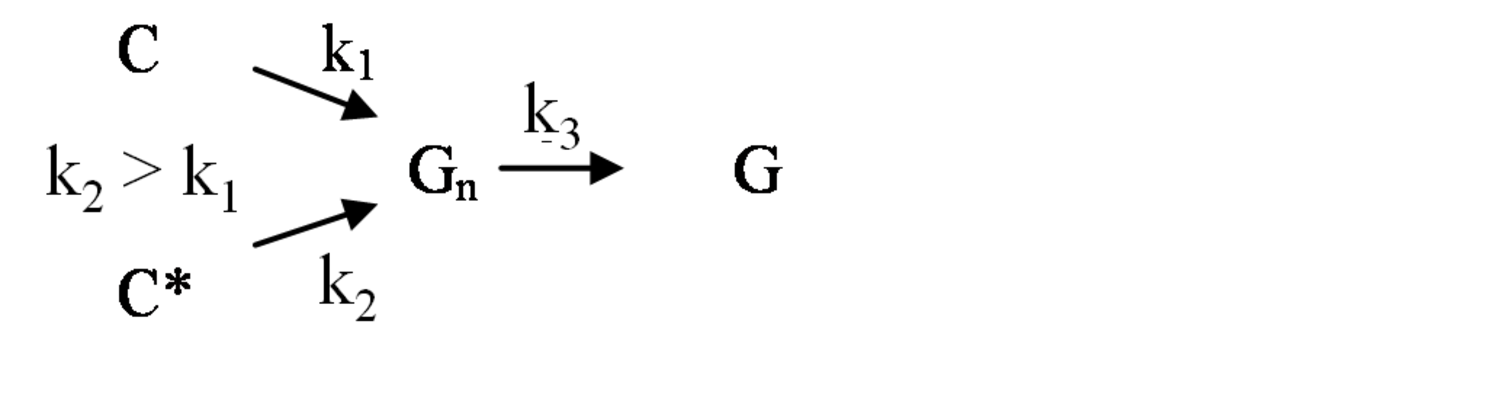
Fig. 5.17: Equation 6
5.12 Impact of Formed Inhibitors
The design of effective pretreatment approaches, particularly in the context of bioprocessing, must consider the formation of inhibitors as well as their effects, so that effective hydrolysis of the cellulosic material may be achieved. The enzyme inhibitors may be hydrolysis products such as glucose or cellobiose (from cellulose), phenols (from lignin), and xylose or xylooligosaccharides (from hemicellulose) [22-26].
Figure 5.18 gives the schematic representation of the inhibition of cellulases. The processing of biomass materials also releases acetic acid from the biomass which is a significant inhibitor of ethanol fermentation. Since acetyl groups are associated with hemicellulose, the processing of the hemicellulose and its removal by pretreatment also releases acetic acid through hydrolysis. Consequently, the acetic acid must either be removed, or microorganisms adapted to its presence so that efficient fermentation may occur. Similarly, the mitigation of furfural and 5-hydroxymethyl furfural formed during pretreatment must also be addressed.3
Hydrolysis of lignin and other phenolic compounds during pretreatment of biomass may form inhibitors that may deactivate cellulase enzymes as described by Ximenes (2010, 2011) [23,25], Kim (2011) [26], and to a greater extent, β-glucosidases (Figures 5.20 and 5.21). The polymeric phenol tannic acid was a major inhibitor and deactivator for all of the enzyme activities tested in our studies (filter paper, endoglucanase and β-glucosidase assays), with monomeric phenolic compounds having a less pronounced effect at phenolic : protein ratios of 0.3 and 1.5 mg/mg (equivalent to 0.5-0.7 mg of phenol/units). Our results showed that tannic, ferulic and ρ-coumaric acids inactivated β-glucosidases from two different microorganisms (Trichoderma reesei reesei and Aspergillus niger) that are commonly used to produce commercial cellulases.
Hence, the identification and development of β-glucosidases that resist inhibition from both sugars and phenols will enhance cellulose hydrolysis. Alternative strategies include carrying out enzyme hydrolysis over shorter periods of time to decrease time-dependent deactivation, removing phenolics prior to enzyme hydrolysis by separation methods (including washing of the pretreated biomass), or using microbial, enzymatic, or chemical methods of converting the phenolics to an inactive form.
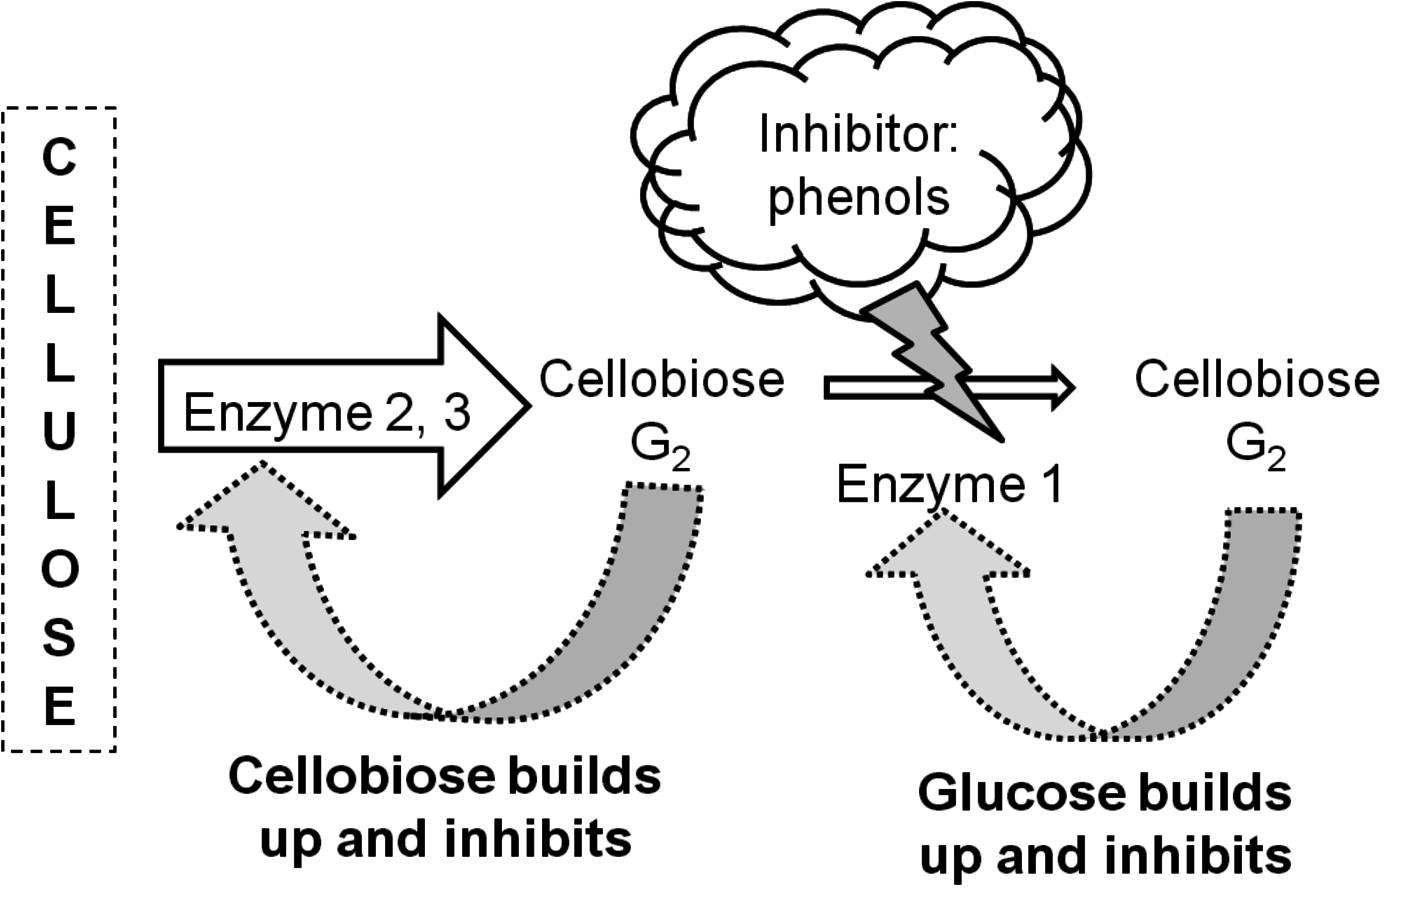
Fig. 5.18: Schematic representation of inhibition of cellulase enzymes
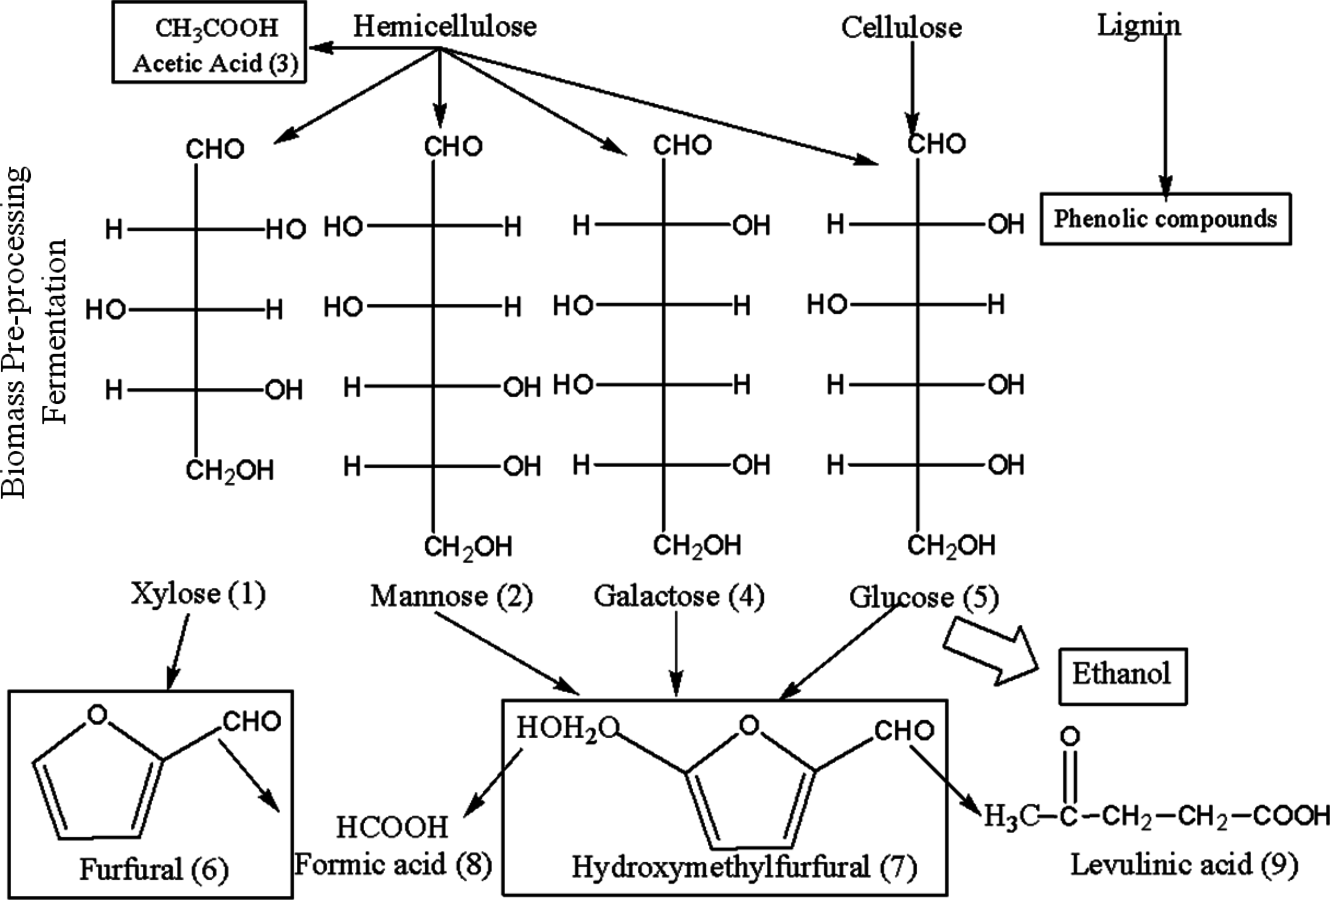
Fig. 5.19: Sources of enzyme and fermentation inhibitors in the pretreatment of lignocellulosic materials (adapted from [51]). Inhibitors are derived from phenolics released from lignin, sugar degradation products, and products of hydrolysis (cellobiose and glucose) and fermentation (ethanol).
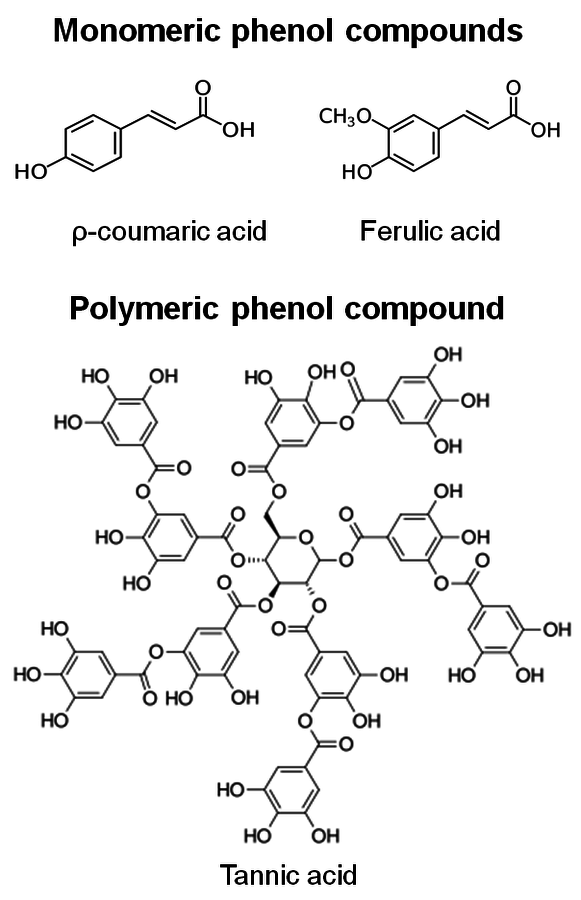
Fig. 5.20: Structures of phenolic inhibitors [23,25]
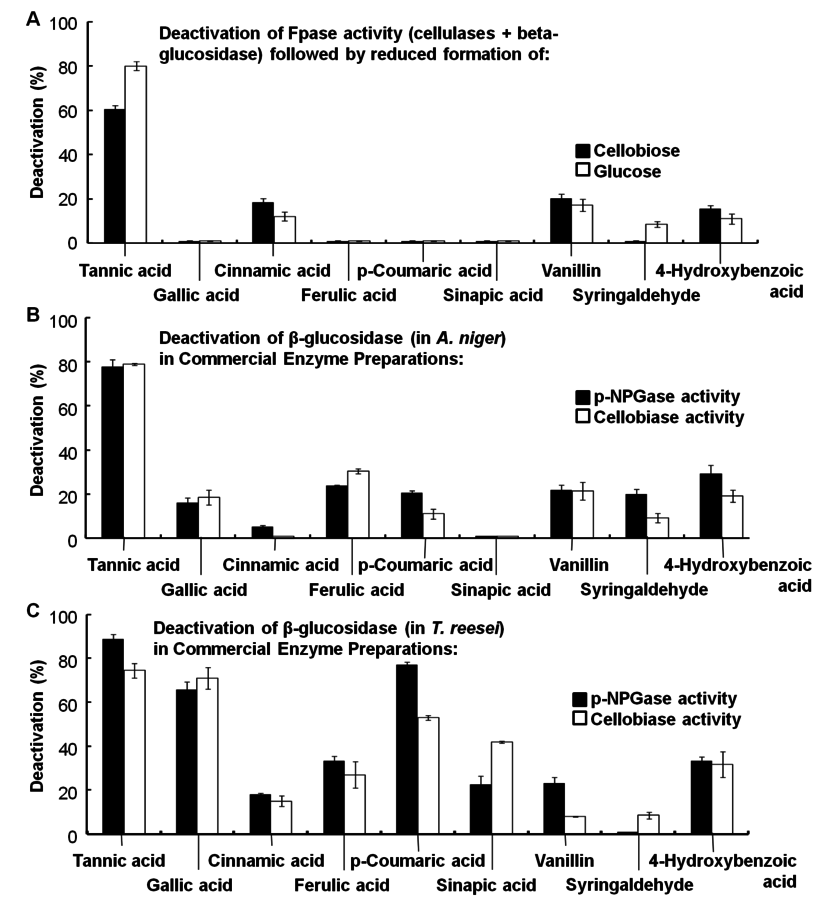
Fig. 5.21: Deactivation of cellulase enzymes by phenolic compounds (from [25]). Baseline activities: (A) 100% FPase in Spezyme, (B) and (C) 100% para-NPGase and 100% cellobiase in Novozyme 188 and Spezyme CP, respectively, against which losses in enzyme activity, due to phenolic compounds, are measured.
5.13 Conclusions
The composition of lignocellulosic biomass materials will vary across species, and materials will depend on both species and harvesting methods. Softwoods and hardwoods will be supplied in the form of chips with characteristic dimensions measured in centimeters, while corn stover (ground stalks and leaves) and switchgrass have dimension in the range of millimeters. Sugarcane bagasse is somewhere in between. This chapter, while ignoring the effect of particle sizes of different materials entering the pretreatment process, discussed the chemistry of biomass and how it relates to potential yields of ethanol. Common denominators of recalcitrance found across all species may be addressed by pretreatment. Cooking biomass in water increases accessibility and susceptibility for cellulases that depolymerize, e.g., monosaccharides. An optimal range of temperature and pressure must be identified to enhance reactivity of lignocellulosic materials, while avoiding underived modification into species that are not fermentable.
Acknowledgments
The authors thank Dr. Miroslav Sedlak and Mr Isaac Emery of Purdue University for their internal review of this manuscript. The material in this work was supported by Mascoma Corporation Sponsored Research Grant, Department of Energy Grants GO18103, GO17059-16649, 0012846, DE-SC0000997, and the symposium sponsored by NSF-PIRE (OISE07302270). This work includes information from the National Academies Report on the American Energy Future and the website of Oak Ridge National Laboratory.
Bibliography
[1] America ' s Energy Future Panel. Liquid Transportation Fuels from Coal and Biomass: Technological Status, Costs, and Environmental Impacts. Washington, DC: The National Academies Press, 2009
[2] W.E. Mabee, D.J. Greg, D. G., Arato D.J., A. D., C. Arato, C. A., Berlin C., B. C., A. Berlin. Update on Softwood to Ethanol Process Development Applied Biochemistry and Biotechnology 29: 55-70 (2006): 55-70.
[3] ORNL. Bioenergy conversion factors Oak Ridge National Laboratory, Oak Ridge, Tennessee, USA, http://www.ornl.gov/. .
[4] R.E.H. Sims, W. Mabee, W. M., Saddler W.. An Overview of Second Generation Biofuel Technologies Bioresource Technology 101: 1570-1580 (2010): 1570-1580.
[5] Prentiss & Carlisle () Michigan Timber Market Analysis for the Michigan Department of Natural Resources.
[6] F.O. Lichts. Industry Statistics: 2010 World Fuel Ethanol Production., 2010
[7] A. Eisentraut. Sustainable Production of Second-Generation Biofuels. Potential and Perspectives in Major Economies and Developing Countries. Paris: International Energy Agency IEA/OCD, 2010
[8] E. Sundfeld. Bionergy Technology Development in Brazil. .
[9] A.K. Bera, M. Sedlak, M. S., Khan M.. Establishment of L-Arabi- nose Fermentation in Glucose/Xylose Co-Fermenting Recombinant Saccharomyces Cerevisiae 424A (LNH-ST) by Genetic Engineering Applied Microbiology and Biotechnology 87: 1803-1811 (2010): 1803-1811.
[10] N.W.Y. Ho, Z. Chen, Z. C., Brainard Z.. Successful Design and Development of Genetically Engineered Saccharomyces Yeasts for Effective Co-Fermentation of Glucose and Xylose from Cellulosic Biomass to Fuel Ethanol Advances in Biochemical Engineering/Biotechnology 65 : 163-192 (1999): 163-192.
[11] N.W.Y. Ho, Z. Chen, Z. C., Brainard Z.. Genetically Engineered Saccharomyces Yeasts for Conversion of Cellulosic Biomass to Environmentally Friendly Transportation Fuel Ethanol. In: ACS Symposium series No. 767. Green Chemical Syntheses and Processes Ed. by Anastas P.T., Heine L.G., H. L.., 2000. 143-159.
[12] M. Kuyper, H.R. Harhangi, H. H., Stave H.R., S. H., A.K. Stave, A. S., Winkler A.K., W. A., A.A. Winkler. High-Level Functional Expression of a Fungal Xylose Isomerase: The Key to Efficient Ethanolic Fermentation of Xylose by Saccharomyces Cerevisiae FEMS Yeast Research 4: 69-78 (2003): 69-78.
[13] M. Sedlak, N.W.Y. Ho. Production of Ethanol from Cellulosic Biomass Hydrolysates Using Genetically Engineered Saccharomyces Yeast Capable of Co-Fermenting Glucose and Xylose Applied Biochemistry and Bio- technology 113–116: 403-405 (2004): 403-405.
[14] K. Karhumaa. Investigation of Limiting Metabolic Steps in the Utilization of Xylose by Recombinant Saccharomyces Cerevisiae Using Metabolic Engineering Yeast 22: 359-368 (2005): 359-368.
[15] E. Casey, M. Sedlak, M. S., Ho M.. Effect of Acetic Acid and pH on the Cofermentation of Glucose and Xylose to Ethanol by a Genetically Engineered Strain of Saccharomyces Cerevisiae FEMS Yeast Research 10: 385-393 (2010): 385-393.
[16] D.W. Templeton, C.J. Scarlata, C. S., Sluiter C.J.. Compositional Analysis of Lignocellulosic Feedstocks. 2: Method Uncertainties Journal of Agricultural and Food Chemistry 58: 9054-9062 (2010): 9054-9062.
[17] M. Kim, D.F. Day. Composition of Sugar Cane, Energy Cane, and Sweet Sorghum Suitable for Ethanol Production at Louisiana Sugar Mills Journal of Industrial Microbiology and Biotechnology (2010):.
[18] B. Du, L.N. Sharma, L. S., Becker L.N., B. L., C. Becker, C. B.. Effect of Varying Feedstock-Pretreatment Chemistry Combinations on the Formation and Accumulation of Potentially Inhibitory Degradation Products in Biomass Hydrolysates Biotechnology and Bioengineering 107: 430-440 (2010): 430-440.
[19] E.S. Domalski, T.A. Milne. Thermodynamic Data for Biomass Materials and Waste Components. The ASME Research Committee on Industrial and Municipal Wastes. New York: The American Society of Mechanical Engineers, 1987
[20] S. Schwietzke, M. Ladisch, M. L., Russo M., R. M., L. Russo, L. R., Kwant L., K. L., K. Kwant, K. K., Mäkinen K., M. K., T. Mäkinen. Analysis and Identification of Gaps in Research for the Production of Second Generation Liquid Transportation Biofuels. Paris: International Energy Agency IEA/OCD, www.iea.org, 2008
[21] W. Vermerris. Composition and Biosynthesis of Lignocellulosic Biomass. In: Genetic Improvement of Bioenergy Crops New York: Springer, 2008. 89-142.
[22] R. Kumar, C.E. Wyman. Effect of Supplementation at Moderate Cellulase Loadings on Initial Glucose and Xylose Release from Corn Stover Solids Pretreated by Leading Technologies Biotechnology and Bioengineering 102: 45-67 (2009): 45-67.
[23] E. Ximenes, Y. Kim, Y. K., Mosier Y., M. Y.. Inhibitors of Cellulose Hydrolysis in Wet Cake Enzyme and Microbial Technology 46: 170-176 (2010): 170-176.
[24] Q. Qing, B. Yang, B. Y.. Xylooligomers are Strong Inhibitors of Cellulose Hydrolysis by Enzymes Bioresource Technology 101: 9624-9630 (2010): 9624-9630.
[25] E. Ximenes, Y. Kim, Y. K., Mosier Y., M. Y.. Deactivation of Cellulases by Phenols Enzyme and Microbial Technology 48: 54-60 (2011): 54-60.
[26] Y. Kim, E. Ximenes, E. X., Mosier E.. Soluble Inhibitors/Deactivators of Cellulase Enzymes from Lignocellulosic Biomass Enzyme and Microbial Technology 48: 408-415 (2011): 408-415.
[27] L.B. Selinger, C.W. Forsberg, C. F.. The Rumen: A Unique Source of Enzymes for Enhancing Livestock Production Anaerobe 2: 263-284 (1996): 263-284.
[28] I. Benoit, E.G.J. Danchin, E. D., Bleichrodt E.G.J.. Biotechnological Applications and Potential of Fungal Feruloyl Esterases Based on Prevalence, Classification and Biochemical Diversity Biotechnological Letters 30: 387-396 (2008): 387-396.
[29] Y. Nishiyama, P. Langan, P. L.. Crystal Structure and Hydrogen-Bonding System in Cellulose Ibeta from Synchrotron X-Ray and Neutron Fiber Diffraction Journal of the American Chemical Society 124: 9074-9082 (2002): 9074-9082.
[30] N.S. Mosier, C.E. Wyman, C. W., Dale C.E., D. C., B.E. Dale. Features of Promising Technologies for Pretreatment of Lignocellulosic Biomass Bioresource Technology 96: 673-686 (2005): 673-686.
[31] J.F. Matthews, C.E. Skopec, C. S., Mason C.E., M. C., P.E. Mason, P. M., Zuccato P.E.. Computer Simulation Studies of Microcrystalline Cellulose Ibeta Carbohydrate Research 341: 138-152 (2006): 138-152.
[32] M.E. Himmel, S.Y. Ding, S. D., Johnson S.Y., J. S., D.K. Johnson, D. J.. Biomass Recalcitrance: Engineering Plants and Enzymes for Biofuels Production Science 315: 804-807 (2007): 804-807.
[33] K. Meyer, A.M. Shirley, A. S., Cusumano A.M., C. A.. Lignin Monomer Composition is Determined by the Expression of a Cytochrome P450-Dependent Monooxygenase in Arabidopsis Proceedings of the National Academy of Science USA 95: 619-6623 (1998): 619-6623.
[34] J. Ralph, C. Lapierre, C. L., Marita C., M. C., J.M. Marita, J. M., Kim J.M., K. J., H. Kim. Elucidation of New Structures in Lignins of CAD- and COMT-Deficient Plants by NMR Phytochemistry 57: 993-1003 (2001): 993-1003.
[35] X. Li, E.A. Ximenes, E. X., Kim E.A., K. E., Y. Kim, Y. K.. Lignin Monomer Composition Impacts Arabidopsis Cell Wall Degradability Following Liquid Hot-Water Pretreatment Biotechnology for Biofuels 3: 1-7 (2010): 1-7.
[36] X. Li, J.K. Weng, J. W.. Improvement of Biomass Through Lignin Modification The Plant Journal 54: 569-581 (2008): 569-581.
[37] F. Chen, R.A. Dixon. Lignin Modification Improves Fermentable Sugar Yields for Biofuel Production Nature Biotechnology 25: 759-761 (2007): 759-761.
[38] A. White, D.R. Rose. Mechanism of Catalysis by Retaining Beta-Glyco- syl Hydrolases Current Opinion in Structural Biology 7: 645-651 (1997): 645-651.
[39] K.L. Kohlmann, A. Sarikaya, A. S., Westgate A., W. A., P.J. Westgate, P. W.. Enhanced Enzyme Activities on Hydrated Lignocellulosic Substrates. In: 207th American Chemical Society National Meeting, ACS Symposium series No. 618. Enzymatic Degradation of Insoluble Carbohydrates Ed. by Penner M., Saddler J.. Washington DC: American Chemical Society, 1995. 237-255.
[40]
[41] N.S. Mosier, P. Hall, P. H., Ladisch P.. Reaction Kinetics Molecular Action and Mechanisms of Cellulolytic Proteins Advances in Biochemical Engineering 65: 24-40 (1999): 24-40.
[42] J. Weil, P.J. Westgate, P. W., Kohlmann P.J.. Cellulose Pretreatments of Lignocellulosic Substrates Enzyme and Microbial Technology 16: 1002-1004 (1994): 1002-1004.
[43] J.R. Weil, M. Brewer, M. B., Hendrickson M., H. M.. Continuous pH Monitoring during Pretreatment of Yellow Poplar Wood Sawdust by Pressure Cooking in Water Applied Biochemistry and Biotechnology 68: 21-40 (1997): 21-40.
[44] J. Weil, A. Sarikaya, A. S., Rau A., R. A., S.-L. Rau, SL. R., Goetz S.-L.. Pretreatment of Yellow Poplar Sawdust by Pressure Cooking in Water Applied Biochemistry and Biotechnology 68: 21-40 (1997): 21-40.
[45] J.R. Weil, A. Sarikaya, A. S., Rau A., R. A., S.-L. Rau, SL. R., Goetz S.-L.. Pretreatment of Corn Fiber by Pressure Cooking in Water Applied Biochemistry and Biotechnology 73: 1-17 (1998): 1-17.
[46] Y. Kim, R. Hendrickson, R. H., Mosier R.. Liquid Hot Pretreatment of Cellulosic Biomass Methods in Molecular Biology 581: 93-102 (2009): 93-102.
[47] W.S.L. Mok, M.J. Antal. Uncatalyzed Solvolysis of Whole Biomass Hemicellulose by Hot Compressed Liquid Water Industrial & Engineering Chemistry Research 31: 1157-1161 (1992): 1157-1161.
[48] C. Ususki, Y. Kimura, Y. K.. Degradation of Pentoses and Hexouronic Acids in Subcritical Water Chemical Engineering & Technology 31: 133-137 (2008): 133-137.
[49] S.H. Khajavi, Y. Kimura, Y. K., Oomori Y., O. Y.. Degradation Kinetics of Monosaccharides in Subcritical Water Journal of Food Engineering 68: 309-313 (2005): 309-313.
[50] J.R.M. Almeida, T. Modig, T. M., Petersson T., P. T., A. Petersson. Increased Tolerance and Conversion of Inhibitors in Lignocellulosic Hydrolysates by Saccharomyces Cerevisiae Journal of Chemical Technology and Biotechnology 82: 340-349 (2007): 340-349.
[51] E. Palmqvist, B. Hahn-Haegerdal. Fermentation of Lignocellulosic Hydrolysates. II: Inhibitors and Mechanisms of Inhibition Bioresource Technology 74: 25-33 (2000): 25-33.
Footnotes
[30,50,51]; see also Figure 5.19.